4 The iLand viewer
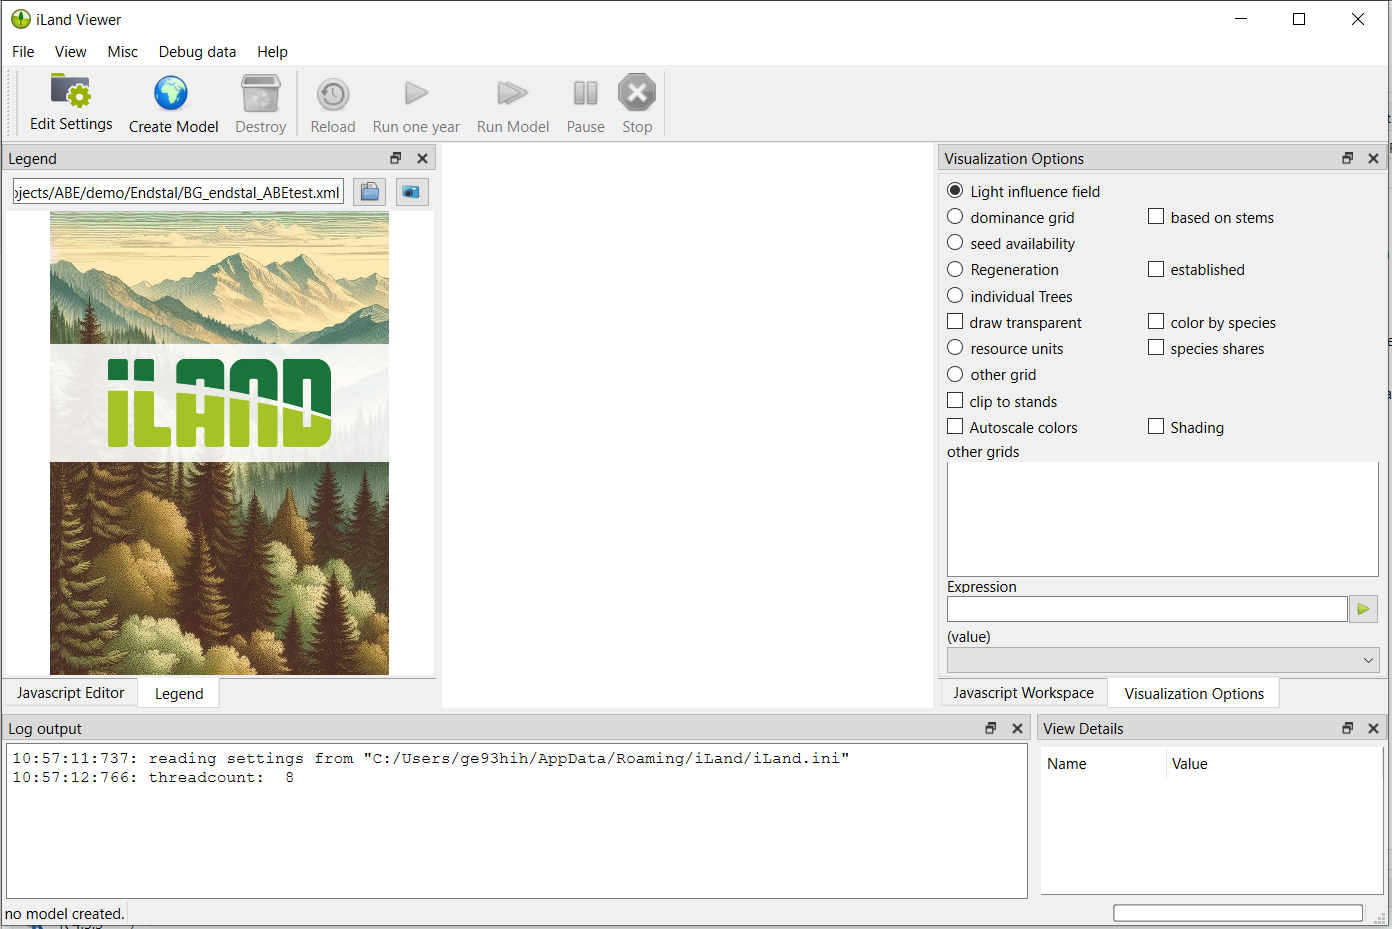
The “iLand viewer” is the the main application of iLand. You can start the program by running iland.exe (on Windows). When you just started iLand, no landscape is loaded (Figure 4.1). In order to load a project, select a project file (see previous section) either via File->Open or from the side panel. iLand remembers recently loaded projects (File -> Recent files). When you click the Create Model in the toolbar, iLand loads the initial state of the selected project / landscape as defined in the project file.
When a project is successfully loaded (indicated by a success message in the status bar at the bottom of the window), you can start a simulation! Do this by clicking the Run one year or Run Model buttons in the tool bar.
As soon as a project is loaded, iLand provides different means to visualize and interact with the model (i.e., with the simulated landscape and its vegetation) that are described in more detail below (Figure 4.2).
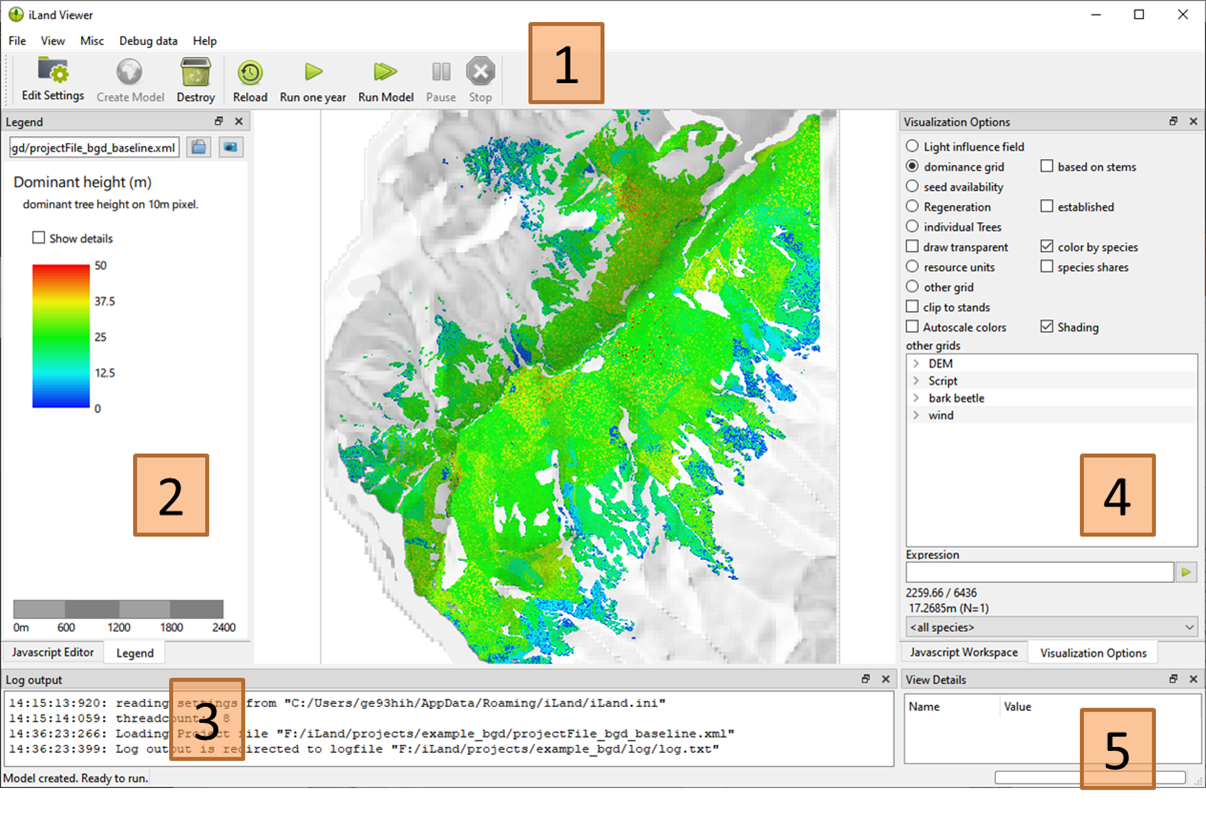
(1) The toolbar provides access to the most important functions: you can create / destroy a landscape (destroying means deleting and freeing all resources), or reload the model (which is a quicker way to destroy and recreate the landscape). Furthermore, you can run the model for 1 year or multiple years. While running, you can pause or cancel (Stop button) the execution. You can also edit settings in the project file with the Settings Editor.
(2) The main panel shows the legend, but also provides access to the scripting engine - see Section 4.2
(3) The logging area shows all the log messages from the model (if logging is not redirected to a log file). This kind of log info is especially helpful to track configuration or model errors.
(4) There are many options to customize the main visualization in iLand (see Section 4.3)
(5) Clicking on a single tree or on a resource unit populates this detail view of tree/resource unit variables
4.1 Settings Editor
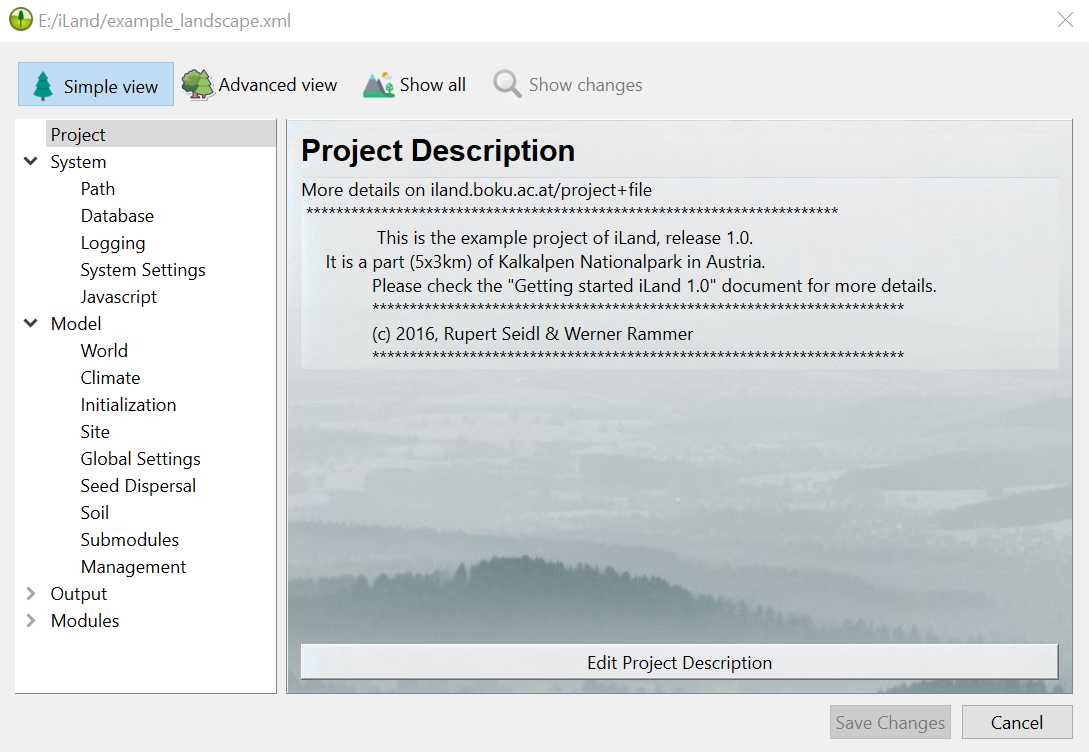
In iLand 2.0 the Settings Editor was introduced. The Settings Editor depicts a GUI-interface to work with the XML-project file in a more intuitive manner, especially for those who are new to iLand:
Parameters can be set both via the Settings Editor and directly via the project file. Above all, comments are also part of both representations:
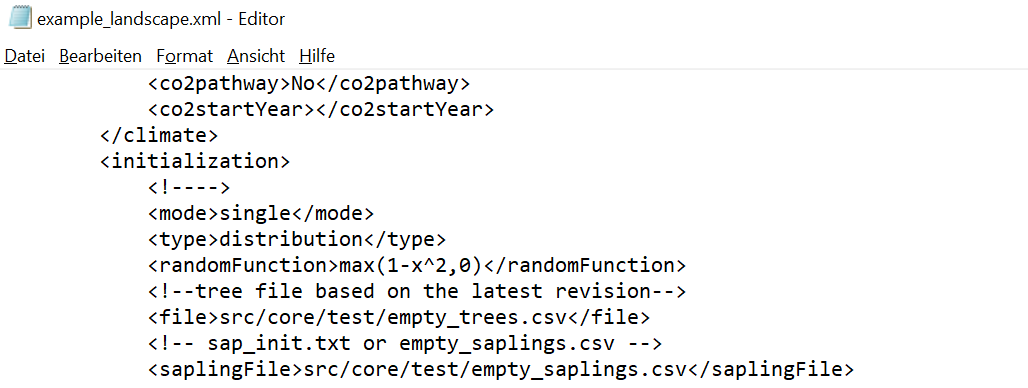
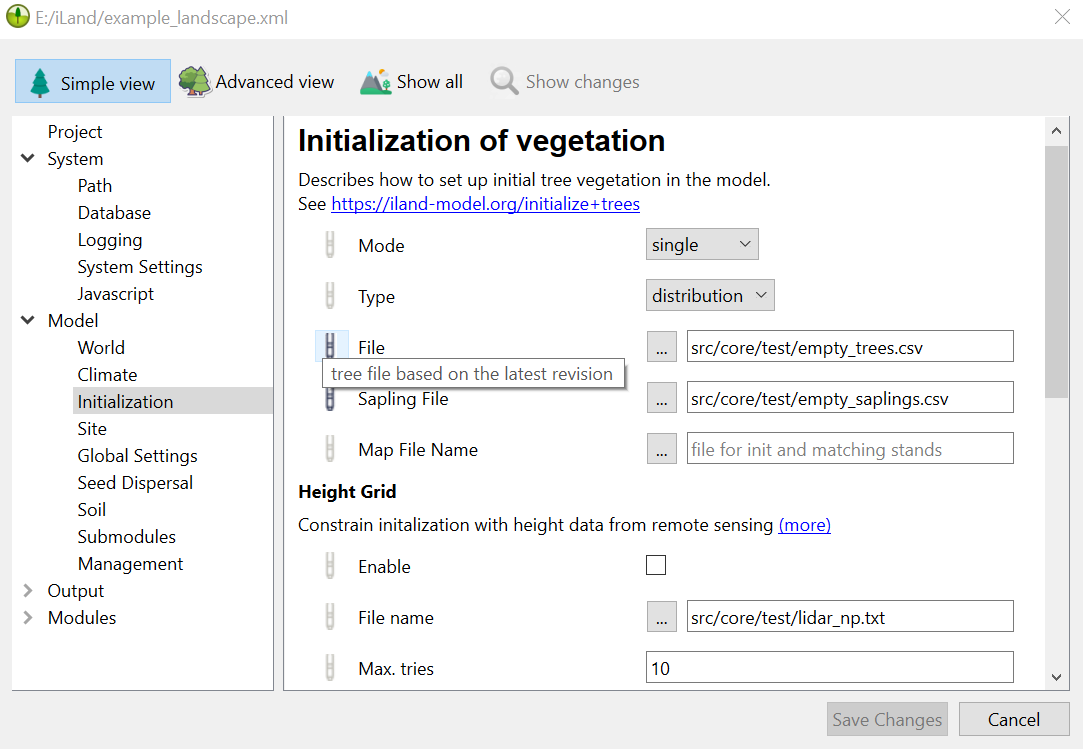
However, it is important to note that in the end it is still the XML-file that determines the simulation. The Settings Editor only provides a convenient way to edit the project file, so it is still worth getting familiar with the project file and its structure.
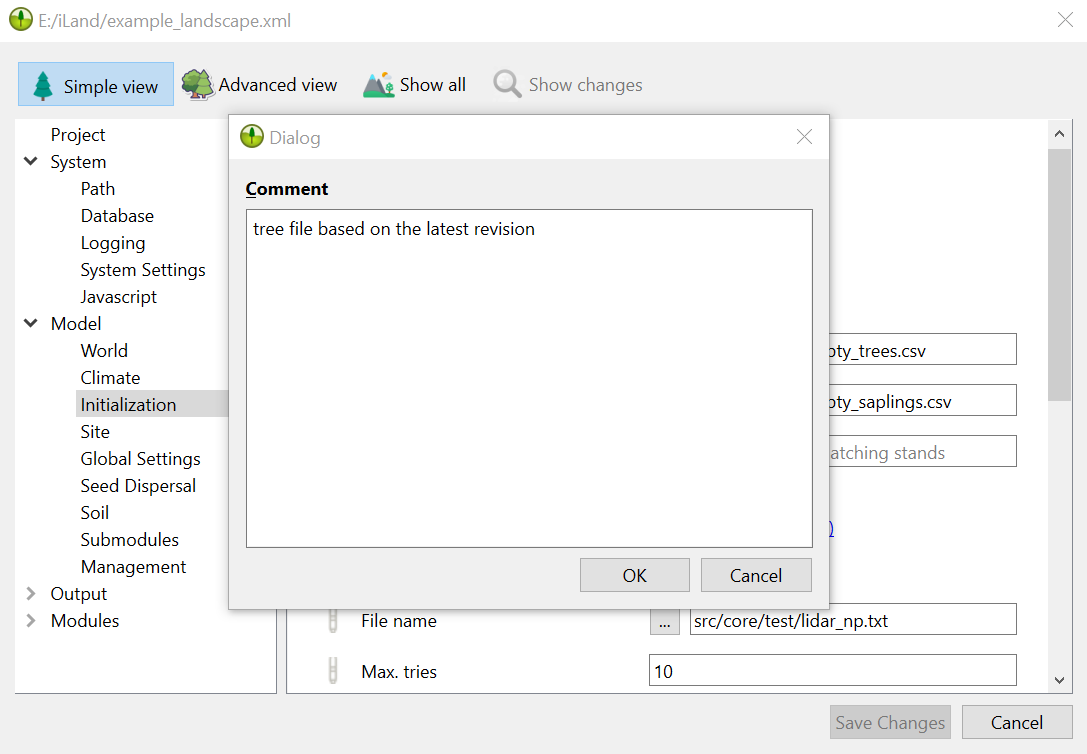
The Save Changes and Show changes buttons will be activated when parameters have been changed. Show changes opens a dialog with which you can follow changes made during the active Settings Editor session. By pressing Save Changes all changes are accepted and saved to the project file, which is overwritten in the process.
4.2 Main side panel
The main side panel (typically on the left side of the window) contains two “windows” that are organized as tabs: The “legend” shows the legend for the current visualization and a ruler, while the “Javascript editor” tab lets you access the JavaScript engine.
4.2.1 Legend
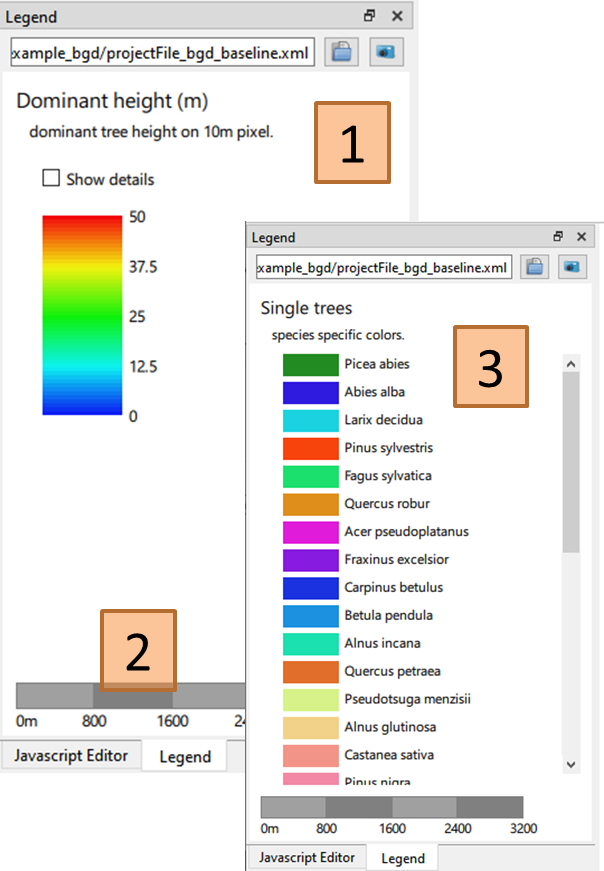
(1) Click the ‘open’ icon to select an XML project file (or use the File->Open command). Note that selecting a file does not load the project!
(2) The legend depends on the selected visualization option; there are, broadly speaking, two types of legends: continuous numerical values (such as tree heights or standing volume) and categorical values (such as tree species or stand IDs). For continuous variables, the value range can be edited after checking “show details”.
(3) The scale bar shows the scale of the current visualization in meters.
4.2.2 Javascript editor tab
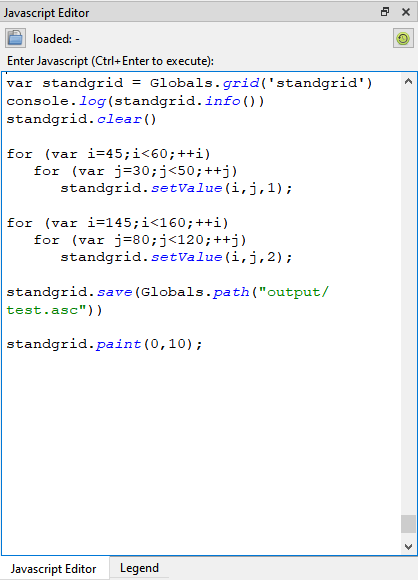
The Javascript editor tab allows the direct access to the JavaScript engine in iLand. You can use the editor window to add / edit and work with JavaScript code. This can be user-defined functions, calls to the iLand system libraries, or even full programs (Figure 4.6). Moreover, you can execute/run code using Ctrl+Enter key combination interactively - that is, you can execute code that retrieves data from the model (e.g., a map of currently dominant species), or that even modifies the state of the model (e.g., by harvesting / killing trees). The text output (e.g. results of console.log() calls) is printed to the iLand log window. See Section 6.3.3 for more details on the code editing capabilities of iLand!
4.3 Visualization
iLand provides means to visualize what is “going on” in the simulation. This feature has many times proven to be very important and useful: It allows researchers to get a feeling of what is really happening in the model, and it is a powerful tool for spying problems, but also for finding cues for solving those issues. The visualization options are in typically on the right side of the main window (denoted with (4) in Figure 4.2).
The following picture zooms in on the available options.
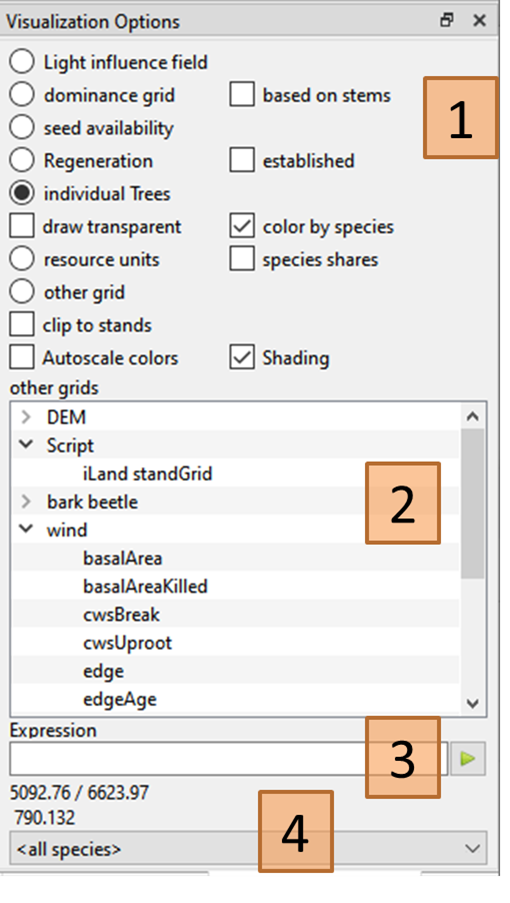
Sections include (1) basic options, (2) show additional layers provided by submodules (e.g, disturbance modules), (3) apply and visualize user defined expressions, and (4) visualize only a selected species.
These basic options (1) are:
Light influence field
Shows the light influence field (LIF). Red means low, blue high light levels. Spatial resolution is a 2m grid.dominance grid
Shows maximum tree and crown heights at 10m resolution; Areas outside of the project area are either drawn grey (areas that are assumed to being forested) or white (for non-forested areas). Enabling the “based on stems” option shows the top height only based on tree stemsseed availability
Shows the seed availability of a selected species (the dropdown species filter in (4)) on the 20m seed dispersal grid. Colors indicate the density of seeds on a cell.regeneration
Shows the state of the regeneration layer (2m resolution). The height of cohorts are shown for a selected species (dropdown species filter in (4)). If no species is selected, the value is the maximum height of all living cohorts on that pixel. Note, that the maps are generated on the fly and may be slow to create. If the “established” box is checked, only newly established cohorts are shown (with value=1 for pixels with new cohorts).individual trees
Shows tree crowns from bird’s eye perspective (i.e. as stylized circles with the radius indicating the size of the tree crown). The color indicates their competitive status as described by the light resource index (LRI, again, red means low LRIs, see competition for light). Check ‘color by species’ to draw trees in species-specific colors. The “draw transparent” option adds transparency, which may help visualize dense multi-story forests. Use the species filter (4) to limit drawn trees only to a single species.resource unit
Shows the resource units, i.e., a 100m grid used for the calculation of, e.g., the water balance. Shown is either the result of an expression (see below), or species proportions (when “species shares” is checked): In this case, if no species is selected (4), each resource unit is drawn with the color of the dominant species, i. e., the species with the highest basal area share. The color is dashed if the dominant species has a share < 50% (i.e., shows not a clear dominance). If a species is selected, then the basal area of that respective species is drawn (you may check the “autoscale” option).other grids
Some modules of iLand provide additional grids that can be visualized (2). Examples are a digital elevation model, details of disturbance modules, and several layers of the agent based forest management engine. Each layer has a brief description and has a legend (i.e., color ramp and value range) shown in the main panel in Figure 4.2.additional checkboxes
“Clip to stands” masks out grids (especially useful for the “other” grids) with the project area (as given by the stand grid). “Autoscale colors” scales the visualization to the value range provided in the data. Note, that this does not work for all options. “Shading” works only when a DEM is available; it then overlays the DEM shading in the current visualization.
As described above, “Other grids” (section (2)) show different layers that are provided by modules of iLand and works much like a GIS application.
The “Expression” box (section (3)) can be used to visualize trees or resource units based on user-defined mathematical expressions (such as dbh*dbh/4*3.1415). Which variables are available from iLand depends on the type of object; for trees, you can use dimensions (dbh, height), biomass pools and other state variables (see tree variables). For resource units, you can use current climate (meanTemp, annualPrecip), stand-aggregates (volume, count) and many more (see resource unit variables). See the expression page on the wiki for a detailed description about syntax and available functions.
Clicking on an element in the visualization (e.g., a tree, or a grid cell) shows details of the respective object in the “View Details” window (see (5) in Figure 4.2). The details show (in most cases) all the available variables, which can then be used for expressions.
Expressions are used in many areas in iLand. One example is management, where tree selection / filtering is based on expressions. You can test (and debug) these expressions simply by playing around in the user interface!
4.3.1 Example visualizations
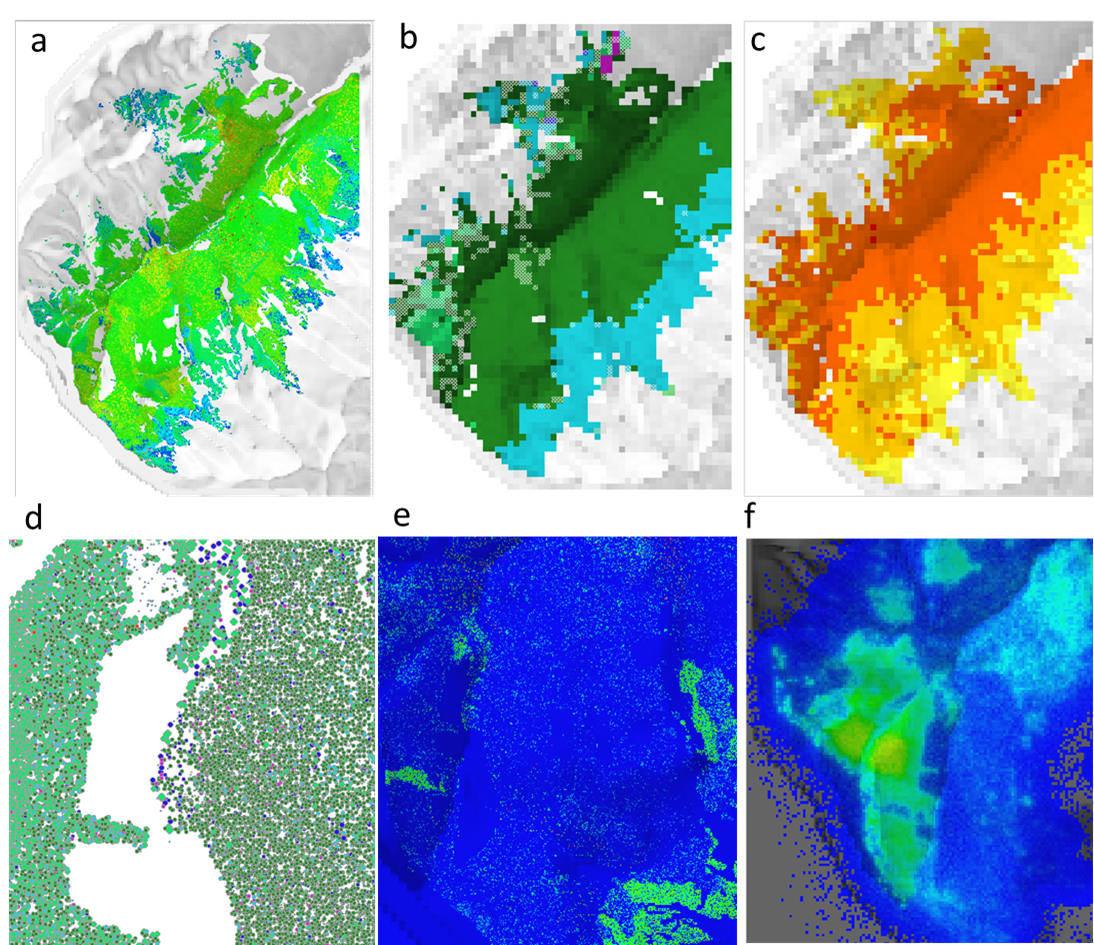
The following figure exemplifies how iLand can be used to visualized different types of data:
| Panel | Description |
|---|---|
| a | “Dominance grid”, 10m top height. The background shows the digital elevation model, “shading” is enabled. |
| b | Dominant species on resource unit (100m) level. Colors indicate species (e.g., dark green is spruce). Dashed cells indicate that no species has more than 50% of the basal area. |
| c | A layer of the bark beetle module, namely the number of potential bark beetle generations per resource unit in the current year. |
| d | Individual trees (zoom in) - colored circles are individual trees (color = species). The size of the circle shows the crown size. |
| e | Regeneration layer (2m spatial resolution). The color indicates the maximum height of any cohort on each cell (blue = 0m or no regeneration) |
| f | Available seeds for a species (20m spatial resolution). Green / orange hues indicate more available seeds (spotty pixels on the bottom right indicate long distance dispersal of seeds) |
4.3.2 Using the mouse and keyboard
You can use your mouse and keyboard to pan / zoom within the landscape:
Zoom in/out
Use the mouse wheel (while positioned over the landscape) or use the ‘+’ or ‘-’ keys of the keyboard. For keyboard zoom the focus must be on the landscape, i.e. a single click into the landscape might be necessary.Pan
Click with the left mouse button and drag. After releasing the mouse button the landscape is redrawn (so there is no visual indication during the drag process except the changed mouse cursor).Hover for location and value
The coordinates under the current mouse position are shown above the species filter (section (4) in Figure 4.7). The coordinates are always in meters, and are relative to the location defined in the project file. In addition to the coordinates, the “value” under the mouse is shown (details depend on what is present at the cursor location).Screenshots
You can copy a “screenshot” of the main visualization area to the clipboard by pressingCtrl-Por by selecting “copy image to clipboard” in theViewmenu. In addition, the screenshot is saved as “screenshot.png” in the project directory.More useful keys
PressF5to refresh the visualization area, press theF6key to zoom out to the full landscape.
4.4 Miscellaneous features
4.4.1 Default project file
iLand defaults to the last loaded project file. To accomplish this, iLand saves the name of the last successfully loaded project file in a small text file named lastxmlfile.txt located in the same directory as the executable itself. On startup, iLand uses this information if present. This behavior is overruled, if a XML file name is provided as a command-line argument to the executable (e.g., iland.exe e:\\iland\\project\\project1.xml).
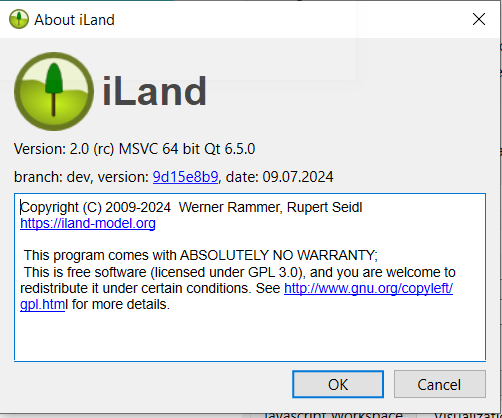
4.4.2 The About box
A little “About” dialog is accessible from the toolbar (Help->About iLand). The about box (Figure 4.9) shows details about the open source licence, and, particularly useful, detailed information about the version of iLand that you are using. Specifically, it shows the current version (here: 2.0 (rc)), and the building environment and Qt version (MSVC 64 bit Qt 6.5.0- this is mostly useful for technical troubleshooting). Moreover, the second line shows the current branch in GitHub (typically prod for production releases or dev for development branch), the short name of the last “git commit” (9d15e8b9) and the build date of the model. The git commit is linked to GitHub, and describes the exact state of the iLand source code that was used to build the executable. See also the chapter on building iLand.
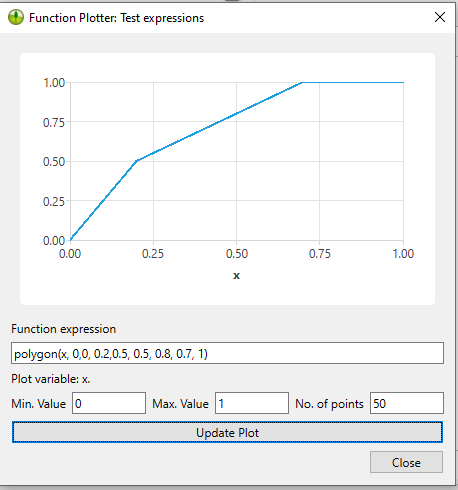
4.4.3 The Expression plotter
iLand contains a little function plotter tool that is based on the expression engine of iLand. You can plot arbitrary functions using the syntax and built-in functions of the expression engine (such as polygon(), or if()). The first unknown symbol encountered is treated as the predictor variable (you get a warning when additional variables are in the expression). The function plotter can be accessed via the menu (Misc->Expression plotter) or from the settings editor. The tool can be very helpful for visualizing allometric or response functions often used for species parameters.