9 Parameterization of new tree species
Species parameterization in forest simulation models is a critical process that entails defining and assigning specific characteristics and behaviors to tree species. In iLand, this meticulous procedure is indispensable for accurately modeling the growth, mortality, and regeneration of individual tree species and their complex interactions.
iLand currently simulates over 100 tree species across Europe, North America, and Japan. Each species is characterized by 66 species-specific parameters. A comprehensive collection of these parameter values can be found in Thom et al. (2024).
9.1 Data requirements and sources
Collecting comprehensive data for parameterization, calibration, and model evaluation is a considerable challenge. In iLand, we have leveraged various data sources, including species trait databases (e.g., TRY Plant Trait database (Kattge et al. 2020)), field data, national forest inventories, peer-reviewed scientific literature (e.g., (Niinemets, Valladares, and Medioambientales 2006)), grey literature (e.g., Silvics of North America (Burns, and Honkala, 1990)), and other ecological models (e.g., (Purves 2007; Nitschke and Innes 2008)). For additional data source ideas, explore the iLand wiki, especially the species parameter page, and review previous iLand publications in your geographic region, especially their supplementary material. For example, Seidl et al. (2012) includes detailed data sources for species parameters in Central Europe and the US Pacific Northwest in their supplementary material, as does Braziunas et al. (2018) for species parameter in the US Northern Rocky Mountains in their supplementary material.
Environmental and forest data, encompassing climate variables, soil conditions, and long-term empirical observations, are essential for effective parameter calibration (see also Ingredients for an iLand project, Setting up landscapes, and Calibration and evaluation chapters).
9.2 Species parameterization process
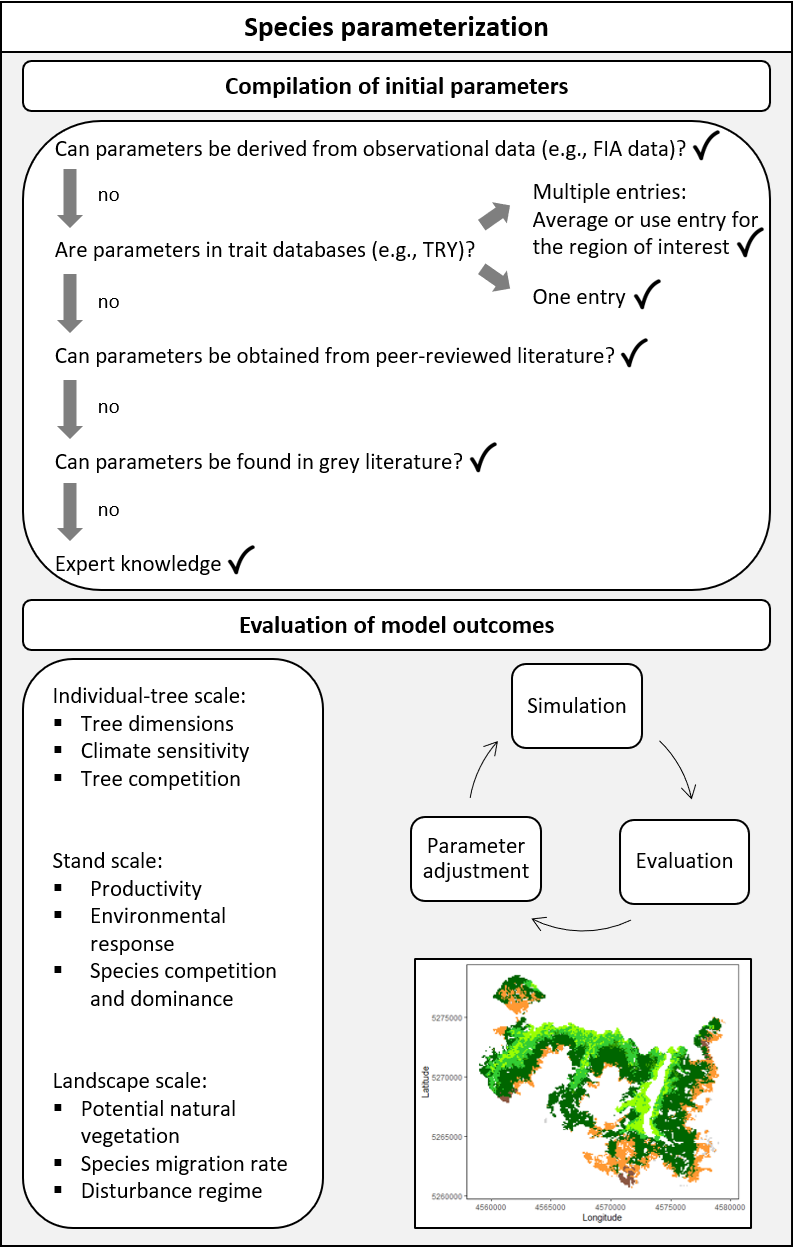
Parameterizing a new species in iLand follows an iterative, step-wise process that is closely intertwined with model evaluation (Figure 9.1). Some parameters can be readily measured in the field or extracted from existing data sources such as those described above, whereas others pose greater challenges and require iterative estimation.
Remember to check whether a tree species has already been parameterized. Initial parameter sets are already available for over 100 tree species (Thom et al. 2024), and subsequent studies may have already added new species (see the iLand publications page).
Once parameters have been compiled, the next steps are calibration and evaluation (next book chapter). Calibration involves iterative adjustments of species parameters based on continuous analysis of model outputs across all relevant spatiotemporal scales: individual tree, stand, and landscape levels. Model evaluation is conducted using a pattern-oriented approach (Grimm et al. 2005). This entails comparing iLand’s outputs against observed patterns, such as individual tree dimensions, stand-level productivity and mortality, tree responses to disturbance, and simulated potential natural vegetation at landscape scales.
iLand’s reliance on first principles in ecology means that site-specific parameter adjustments are not recommended unless they enhance simulation performance across different regions simultaneously, avoiding local overfitting and ensuring robustness under global change conditions. Parameters should broadly represent species across diverse conditions, occasionally sacrificing precision for accuracy in simulated outcomes. For species with wide-ranging conditions or specific applications, distinguishing tree species provenances (e.g., boreal vs. temperate Pinus sylvestris) in parameterization is meaningful.
9.2.1 A tiered approach
Parameters can be sorted into three tiers, with different associated calibration and evaluation steps. The first tier describes tree allometry, growth, and environmental responses, typically obtained from literature sources. These parameters are then evaluated through stand-level simulations focusing solely on growth, temporarily disregarding regeneration and mortality processes (see Productivity and mortality section in next chapter).
The focus then shifts to the second tier, parameters describing tree mortality and aging. These include readily available life history parameters (e.g., maximum age and height) as well as parameters that are difficult to determine empirically and require iterative estimation (e.g., the relationship between mortality probability and carbon starvation). Stand-level evaluations at this stage concentrate on reproducing stand density patterns over time (self-thinning) and simulating maximum tree properties (see Productivity and mortality section in next chapter).
The final tier of parameters characterizes seed production and dispersal, tree establishment, and sapling growth. These include empirically derived estimates (e.g., seed dispersal kernels, sapling growth potential) and more challenging parameters like fecundity (number of seeds produced per unit canopy area). If regeneration data is available, specific evaluation tests can be set up to assess these parameters. In the absence of such data, a coarse filter approach is employed, involving landscape-scale simulations of potential natural vegetation development over long time frames. These simulations are evaluated based on the realism of stem densities and diameter distributions, the proximity of simulated basal area and biomass pools to observed values, and the dominance of expected early- and late-seral species under appropriate conditions. The successful emergence of these expected patterns from the simulation indicates that the parameters related to all three demographic processes (growth, mortality, and regeneration) have been well-specified (see PNV, regeneration, and competition section in next chapter).
9.2.2 Specific parameters with high uncertainty that often require manual testing and calibration
Aging: Will affect both growth and mortality. Plot the curve and to check if early seral species have a more drastic decline in carbon use efficiency than late seral species. This parameter has a great impact, but little is known about it. It can thus be modified with little concern, although always take care that the relative differences with other species makes sense.
Fecundity_m2: The “standard procedure” to derive fecundity as used in the past by iLand users yields very high values. Values beyond 100 are usually unrealistic. Most values should be between 1 and 10. A change here might have a great impact on the dominance of species (e.g., in PNV tests).
HDlow and HDhigh: Can be easily derived from inventory plots, but the result might be quite extreme as trunks might be broken etc. Thus it is important to check whether the range is plausible. If trees grow too thick or too high, this is a good parameter to change.
estMinTemp and estGDDMin: This will change both the spatial range of persistence and also the dominance at the trailing zone. While estMinTemp can be used to rather restrict a species in oceanically influenced ecosystems, estGDDMin might be more useful to restrict the spread into the continental cold zones. However, both likely require adaptation in parallel. I do not recommend using estGDDMax to restrict the growth of species as the parameter is not ecologically meaningful and could thus cause a bias in climate change simulations.
sapHeightGrowthPotential: The parameter is quite uncertain, but can have a large impact on what species will outgrow another one.
lightResponseClass: If a species gets lost too quickly in multi-species tests, it might be because of shade from other tree species. There are multiple studies on shade-tolerance, you might want to check if there are different values or you might have to consider the change in shade tolerance over age (e.g., oak is more shade tolerant in its youth than later).
C allocation, especially bmRoot: If growth doesn’t make sense, these should be checked, although these values are hard to estimate. However, there is quite some uncertainty, especially for root C allocation. It can be useful to check for other publications or within a trait database and try another published value.
respVpdExponent, maxCanopyConductance, psiMin: If you observe drought-induced mortality waves that you wouldn’t expect, these are parameters which should be checked.
respNitrogenClass: If a species doesn’t grow well or dies under specific conditions, this is a parameter that could make a difference. Always think this one relative to the demand of other tree species.
respTempMin and respTempMax: Can improve your growth curve in response to temperature. This makes sense to control relative to other species. In particular, if a species has a wide ecological niche and covers a large spatial area, it is possible that different provenances have a different minimum or optimum to conduct photosynthesis.
Well-known parameters, such as maximumHeight or maximumAge, should not be changed to improve model results.
9.3 Light influence patterns
Every tree species needs to have a light influence pattern (LIP) file in order to run in iLand (more info: competition for light). This LIP file is a lookup table with pre-calculated shading patterns based on a range of tree diameters and heights for the given species; this is created with the standalone Lightroom software. Prior to running Lightroom, parameters should be compiled for HDlow and HDhigh, for crown shape and size (Purves 2007), and for the range of tree sizes that are expected to be simulated in iLand (consider maximumHeight parameter). Then follow the step-by-step instructions on the iLand wiki.
9.4 Biome and landscape parameters
Biome and landscape parameters apply to all trees in the simulation and are set in the project file. These parameters should generally start with default values but can be adjusted if all species are consistently underperforming in evaluation experiments. Always check latitude in the project file to ensure that day length calculations are correct.