Loading...
 

iLand News

Updates on iLand-related news, progress report, activities of the consortium, etc.

Frontiers in modeling wind disturbance

Friday 16 of September, 2011

I guess it’s time for another modeling-oriented blog post, particularly since there are a lot of exciting modeling activities going on in iLand that I don’t want to keep from you. At this point they mostly concern disturbance modeling, and I want to talk about wind today, as I’m currently a visiting scientist at SLU in Sweden, learning a lot about the mechanisms of wind disturbance from Kristina Blennow.
Wind generally is the most important/ detrimental agent in European forests. In the worst year on record, in 1999, 170 Mill. m³ were damaged by wind (mainly the storms Lothar and Martin. And to give you an idea of the economic importance of wind disturbance: The weather system Gudrun in January 2005 damaged approximately 75 Mill. m³ in southern Sweden and was estimated to have caused an economic damage of 2.4 Billion € in forestry alone.

Image
Figure 1: Damage from the storm Gudrun (January 2005) in Sweden. The right picture shows approximately 1.3% of the wood damaged by Gudrun (~1 Mill. m³), stacked ~12m high at a local airfield. Image source: Jimmi Svensson.


So much for the motivation of addressing wind in simulation modeling. As already highlighted before, we really want to go the mechanistic modeling route in iLand, in order to being able to capture emerging properties of vegetation – climate – disturbance interactions. And mechanistic wind modeling has come a long way in recent years (see here and here for recent reviews). However, such concepts are rarely applied in landscape models (mainly due to limitations in the vegetation structure simulated by landscape models, and by computational demand of mechanistic wind simulations), which usually employ a more phenomenological, probabilistic approach. So the challenge we’re currently working on is to bring mechanisms of wind disturbance into the landscape modeling context.

I’ll not go into the details of our approach yet since we’re only about to test a v0.1 of the iLand wind disturbance module. I rather want to highlight two recent developments that I think are quite a big advancements with regard to our aims here. A particular strength of landscape modeling is the simulation of spatial processes in the landscape (think fire spread). These spread processes also occur for wind, as trees mostly start falling at edges, thus exposing a next cohort of trees, which are less adapted (since they have been sheltered) and fall even easier, which in turn exposes even more downwind trees… you get the idea – there is a spatial spread process going on also in a wind disturbance event, that is, however, mostly ignored in landscape modeling. Ken Byrne is to my knowledge the first who has taken on this important spread process in modeling, mechanistically calculating patterns of windthrow via a coupling of the models TASS and ForestGALES. Since iLand is by its very design quite efficient in handling spatial processes across the landscape we’re looking into ways of adopting such a spread algorithm also for iLand. The huge benefit of this would be that patterns and extent of wind damage would be simulated as emerging property of the dynamically simulated stand conditions (rather than being imposed in a “cookie-cutter” approach) – and would thus also be much more useful in the context of decision support for management.

The second recent development I want to highlight is also closely related to one of our favorite topics here at iLand, i.e. individual trees. Most mechanistic wind models to date have focused on average trees in homogeneous stands (and what the downsides of those assumptions are I have reiterated quite exhaustively, I think, so I’ll not go there again in this post). Recently, Hale and coworkers took the next step and investigated the wind loading of individual trees of different size and competitive position in a stand. They found two very interesting things: First, the relationship between tree size and turning moment per wind forcing is surprisingly stable. In other words, the way different trees in a stand respond to wind can be consistently explained by their size. But the imho even more innovative part of their study is that Hale and coworkers show that standard-issue competition indices (used in tree growth modeling) are also strongly related to tree response to wind. In other words, they not only describe the effect of competition well, but also are good proxies for the sheltering effect of local neighbors. This is something that we want to explore further in iLand, as simulating individual tree competition is a particular strength of our model, and employing it also in the context of local wind shelter might be an elegantly way to model how management - by changing vegetation (e.g. through thinning) - can influence disturbances. So big kudos to the colleagues out there doing great work on disturbance mechanisms, and stay tuned for more on modeling disturbances in iLand.

Just for fun: the 'us and them' in science

Monday 15 of August, 2011

Summers are nice for holidays, but are also the time of the year when you can actually get things done (less email, empty university corridors,…). So there’s currently quite a lot going on in iLand world, working on publications (theoretical and applied), developing disturbance models, implementing and testing them…

But rather than giving an update on those things I thought I’d share some more general insights on the science world and its protagonists that I just came across. So true, and funny to think about how we perceive ourselves and our colleagues ;-)

Here again the link: http://www.sotak.info/sci.jpg

Climate and vegetation changes drive disturbance increases in Europe

Wednesday 01 of June, 2011

So one of the main ideas behind the development of iLand is, that to understand and simulate forest ecosystem dynamics with particular consideration of disturbances, an integrated view of climate, disturbance agents, and the vegetation is needed. The idea is that what we observe as forest dynamics is the result of the complex interactions between those three elements.

<img src='tiki-view_blog_post_image.php?imgId=14' border='0' alt='image' />

In a recent effort we’ve been putting this framework to the test with regard to disturbance changes in Europe’s forests. The background: Disturbances have been increasing throughout the continent over the last decades, as my colleague Mart-Jan Schelhaas first reported a few years ago. While the trend is pretty clear its drivers have been subject to some discussion: For western North America, for instance, colleagues recently showed that similar increases were mostly driven by changes in the climate system. But European forests, unlike their western US counterparts, have a long and intensive management history, so also management-induced vegetation changes could be hypothesized as drivers behind observed disturbance increases.

Following the scheme outlined above (which is a modification of an earlier conceptual figure by Virginia Dale and co-workers), our hypothesis was that it wouldn’t be either climate or vegetation changes driving the disturbance increase, but a complex interplay of both. Thus we set out to test this hypothesis on disturbance data for continental scale Europe from 1958 to 2001, using machine learning and structural equation modeling as our main methodological tools.

The results, just published in Global Change Biology, support our general framework, with about two thirds of continental scale disturbance damage from wind and bark beetles occurring under coinciding elevated climate conditions AND increased susceptibility of the forest vegetation. In other words, it’s the interplay of both climate and forest change that caused the recent increase in forest disturbances in Europe. And although the factors differ somewhat between agents (increases in area burnt were most strongly driven by climate, while increases in bark beetle damages were most strongly related to increasing forest susceptibility), this pattern seems to hold for most areas of Europe (read the full results here).

Besides the fact that this is one of the first quantitative studies on the causes of the widespread increase in forest disturbances, there are two broader implications that I deduce from our findings: First, disturbance damages are likely going to increase further, since both the atmosphere as well as forest ecosystems have a long system memory, i.e. the past and current anthropogenic changes to both systems are going to have a continuing effect for many years to come. In our analysis of temporal trends we didn’t find a reversal of a trend towards increasing forest susceptibility and climatic triggers of disturbances yet, quite the opposite actually. From the data it looks like we’re more and more moving towards a highly disturbed forest future. Thus it is highly important to mainstream disturbance thinking in our ecological and management considerations.

The second implication for me is that we’ll need models that are able to incorporate and address those interactions between the climatic environment, the forest vegetation, and a variety of disturbance agents. Models that help us address these effects, and ultimately inform management planning and thus support the sustainable provision of ecosystem services. As our recent review showed, this is still quite a challenge for modeling, but within the iLand project we’re diligently working towards advancing our capacities in this regard.

iLand status report

Saturday 09 of April, 2011

Hello world, hard to believe that two years have passed already since we started on this modeling endeavor. This also means that I (Rupert) am on my way back to Europe after two years in the Pacific Northwest – two truly great years, full of amazing people, forests, and ideas. I thus wanted to take this opportunity to share a bit more information about the current status of iLand.

The model currently

  • simulates individual tree regeneration, growth and mortality in a process-based manner
  • scales seamlessly from the level of individual trees to landscapes (currently tested up to 10^4 ha)
  • simulates carbon, nitrogen and water cycles (currently implemented at a resolution of 100m)
  • includes management and disturbance via a flexible java script interface (currently, those are modeled deterministically in the system, i.e. disturbance regime and landscape scale management allocation and patterns are not yet an emerging property of the simulation)


For model testing, the hierarchical multi-scale approach taken in iLand proved to be highly useful, overcoming the frequent limitations of landscape models with regard to evaluation against empirical data. In a multi-criteria evaluation of iLand, we successfully tested the model against

  • tree growth and mortality in old-growth forest ecosystems of the Western Cascades in Oregon, using long-term vegetation data (at the individual tree level)
  • carbon compartments and stocks of the same long-term vegetation plots (stand level)
  • forest inventory and analysis data for stand productivity over a wide ecological gradient in Oregon and Austria (stand level)
  • gradient nearest neighbor maps of species distribution for a 6400 ha Western Cascades landscape (landscape level)
  • gradient nearest neighbor estimates of (wall-to-wall) stand structure for the same landscape (stand to landscape level)
  • indices of canopy complexity derived from Lidar (stand to landscape level)
  • aboveground carbon maps derived from Lidar (stand to landscape level)


Based on these promising evaluation results, we are currently in the process of applying iLand to questions of landscape complexity and disturbance history at the HJ Andrews experimental forest (for the bigger picture and some hypotheses, see here). More specifically, we’re aiming to use the model to

  • disentangle the functional importance and role of landscape heterogeneity (e.g. on ecosystem C exchange and storage)
  • address the effects of disturbances, and particularly long-term disturbance legacies, on structure and functioning of forest landscapes

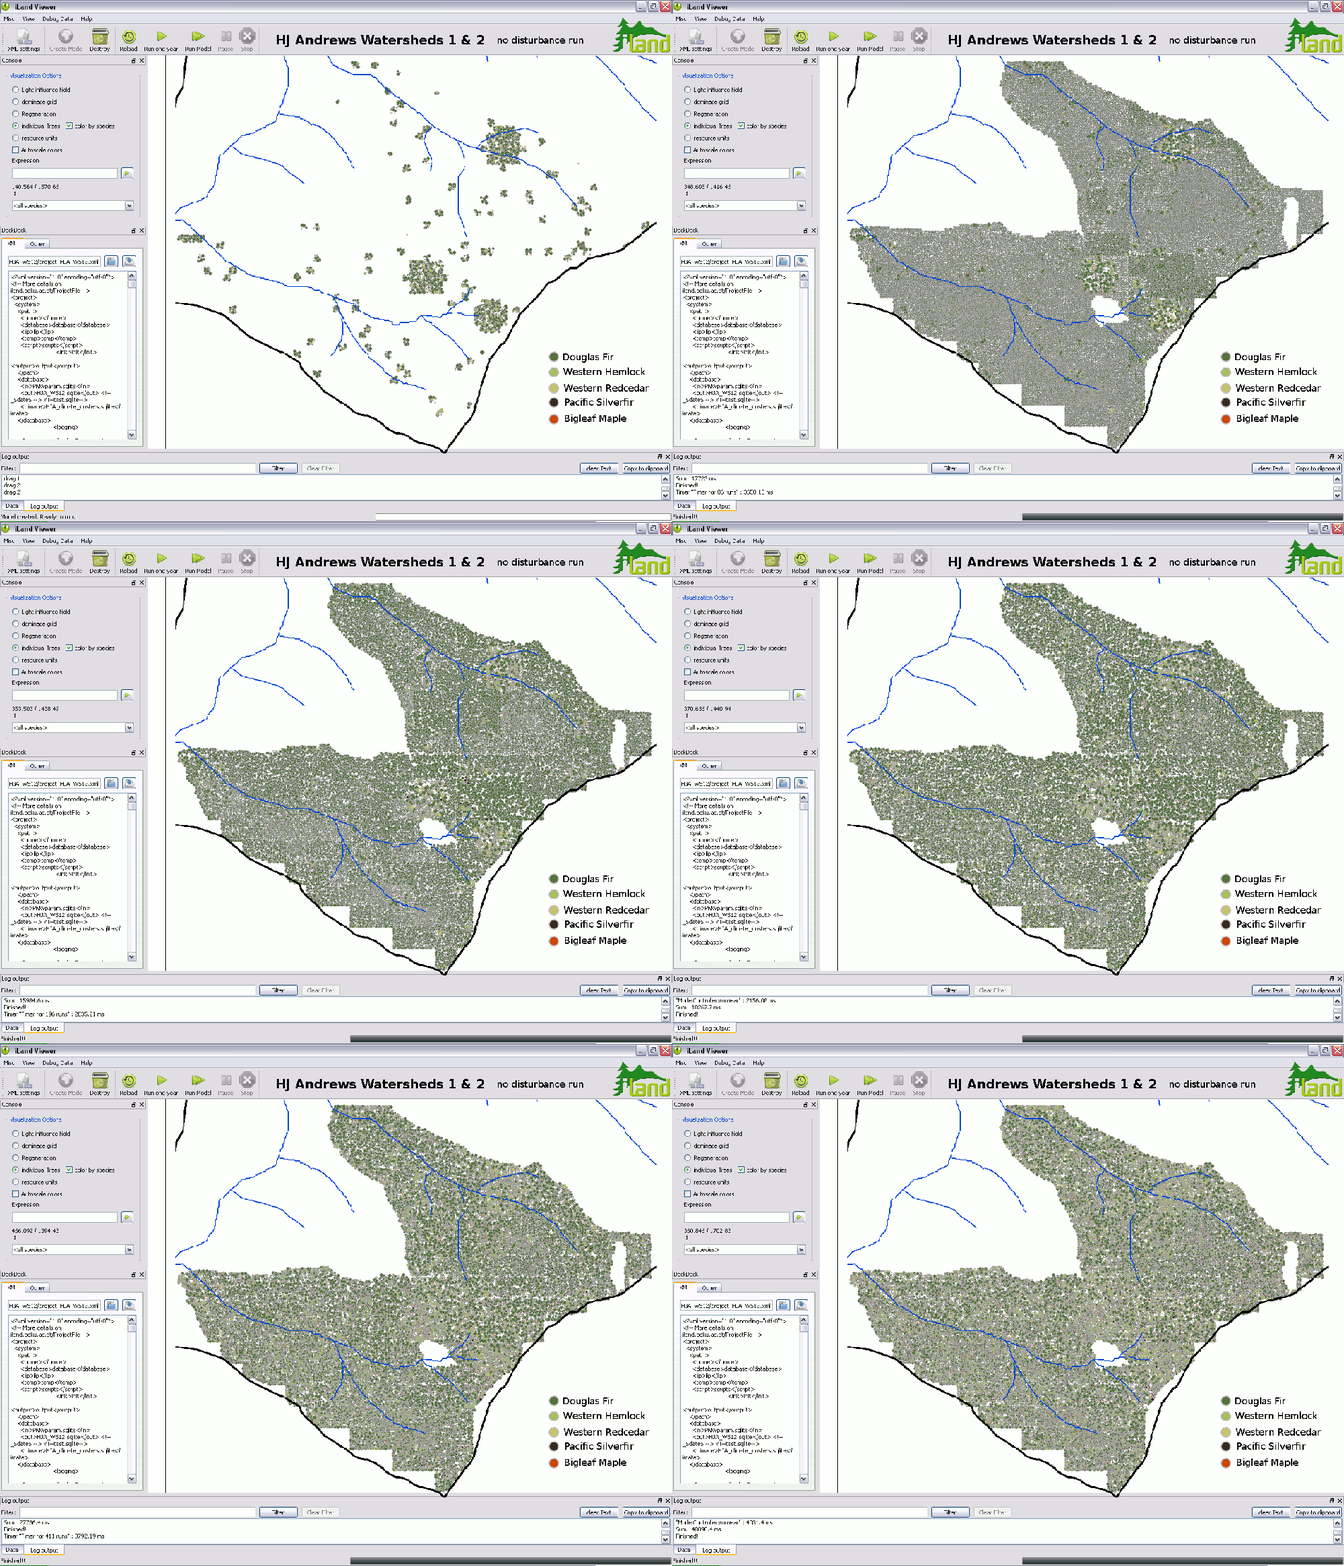
Here are some screenshots of the 6400ha HJ Andrews landscape simulated with iLand:

<img src='tiki-view_blog_post_image.php?imgId=11' border='0' alt='image' width=700/>
<img src='tiki-view_blog_post_image.php?imgId=12' border='0' alt='image' width=700/>
<img src='tiki-view_blog_post_image.php?imgId=13' border='0' alt='image' width=700/>
Figure: Three screenshots of a 500 year iLand simulation for the 6400ha HJ Andrews watershed. Top panel: after a landscape scale high severity fire event around year 1500. Middle panel: before the fire period of the mid 19th century. Lower panel: in the year 2000, after a period of patch clear-cutting.


Model development in the last year of the project will focus in particular of implementing process-oriented disturbance modules in order to simulate disturbance dynamics, and particularly the interaction between disturbances, as emerging property of the model. To that end we will

  • adopt an existing fire model tested and established for the Pacific Northwest
  • adopt a previously developed bark beetle model for the European spruce bark beetle (see here for more details)
  • look into process-based wind disturbance models for incorporation into iLand, such as WINDA


So quite a lot going on, on the ‘iLand’, as you can see… stay tuned to read about our results, and hear more news from the landscape modeling frontier!

Simulating landscape dynamics

Friday 04 of February, 2011

Its time to share some more results here, particularly as I’m excited to report that we’re about to embark on the first comprehensive landscape simulation study with iLand at the HJ Andrews Experimental Forest in the central western Cascades in Oregon. A brief digression: If you don’t know about the HJ Andrews (HJA in short) I’d highly recommend you check it out, it’s an amazing place, in terms of both the ecosystem and the group of people doing research there.
We’re currently retracing the vegetation history for the 6400 ha HJA watershed with iLand, and below is an animation of a simulation for the two research watersheds 1 and 2. It’s one of the first runs that we did for larger portions of the HJA, but the results are quite encouraging, so here is what you see:

Image

We know from extensive work on disturbance history, based on tree cores and fire scare dating, that about 500 years ago the landscape at HJA was hit heavily by stand-replacing disturbances. So we initialized the simulation with only a few remnants of patches representative of the pre-fire vegetation, while the rest of the 171 hectare watershed was assumed to be burnt over with high severity. In these patches, you can see that a high proportion is Douglas fir, i.e. the most fire-resistant species in the area. Douglas fir is also fastest in conquering the newly available growing space, and consequently the first 200 to 300 years are dominated by this species (the dark green in the simulation). However, towards the end of the 500 year model run (screenshots were taken in 5 year intervals for the animation above) the more shade-tolerant species like Western Hemlock and Western Redcedar are gaining ground, regenerating under the Douglas fir dominated canopy and slowly taking over. This can be seen particularly in the legacy patches, i.e. the areas that had survivor trees on them in the beginning of the simulation.

Another interesting thing that comes out in the model run is the environmental gradient in the two watersheds. As visibly by the stream patterns, the topographic gradient in the two watersheds goes from east (ridgetop) to west (valley bottom). The lower reaches are classified as Western Hemlock zone, while the upper reaches already belong to the cooler, wetter transition zone (transition to the montane true fir zone, that is). This gradient is also picked up by iLand, if you look at the occurrence of the occasional mature Pacific Silverfir. I.e. the dark dots appear only towards the eastern edge (i.e. the ridge) of the watershed and are completely absent in the lower reaches of the simulated area.

The last thing that I want to talk about today is environmental heterogeneity. Gaining a better understanding of spatial and temporal heterogeneity in environmental drivers is a main objective in developing iLand. And in this animation the effects of local variability in environmental factors (here rendered with a resolution of 100 x 100m) is quite apparent: The sites with deeper, richer soil, e.g. around the center of the simulated area, regenerate somewhat faster (only trees with a height >4m are drawn in the GUI, hence the explosive appearance of regeneration) than the surrounding areas, and the higher fertility of these sites remains visible long into the mature and old stages of forest development.

Well, I’ll stop here, but just from discussing the little animation above I guess you’ll get the idea of the exciting research questions that a framework like iLand enables us to look into.

Every tree counts

Saturday 11 of December, 2010

As you might already know, we’ve been making it our goal in iLand to “make every tree count”, i.e. to model individuals and their interactions and responses explicitly. Some of our recent progress in model development has focused on implementing a process-based, spatially explicit regeneration module in iLand, and in this regard I briefly want to revisit this “no tree left behind” strategy once more.

But before I do so, let me briefly put this into a greater ecological context. A hotly debated issues in forest ecology over the last years has been the potential migration rate of tree species. This is no surprise, given the mounting pressure from climate change, and the concerns about how trees will be able to cope with this rapid (relative to a trees lifetime) changes. Answering the question how fast trees can potentially migrate turns out to be more complex than it might seem at first glance: In a nutshell, migration rates derived experimentally (in the order of several 10s of meters per year on average) differed substantially from those derived from pollen records documenting the re-invasion of trees since the last glacial maximum (in the order of several 100 to even 1000m per year). Essentially, analyzing the data available from the most recent large scale tree species migration wave after the last ice age resulted in migration rates differing significantly from that inferred from contemporary trees.

A lot has been said on the possible reasons for this divergence, and I’m not attempting to give a complete overview here (see for instance here for more details). I want to highlight one point though: advances in genetics have changed our view of post-glacial vegetation development quite drastically in recent years. From such analyses it gets more and more clear that this large vegetation migration was much less a homogeneous wave as previously pictured, and relied heavily on (relatively small) local refugia. I.e. it gets more and more apparent that local remnants, surviving in sheltered and/or climatically favorable microhabitats contributed significantly to the re-colonialization. Finding such as those described here thus also reconcile the differences between the migration rates found in the literature.

<img src='tiki-view_blog_post_image.php?imgId=8' border='0' alt='image' width=200/>

The moral of the story, in the context of modeling forest ecosystems, is: The local variability in climate, in combination with ecological legacies (e.g. trees left after disturbances, see photo, showing disturbance legacies in the Biscuit Fire), can have a distinct influence on the trajectory of vegetation dynamics. And it thus might be important to capture those aspects in our models, particularly if we’re interested in projecting vegetation dynamics under changing environmental conditions. Below are two series captured from the iLand GUI illustrating this point: On the top, migration of trees occurs only from a (hypothetical) seed source to the west of the simulated transect (1400m x 300m), while in the lower panel I also simulated a disturbance legacy of 10 mature Douglas fir trees (in the east part of the transect). Although a rather simplified simulation experiment (for demonstration purposes e.g. climatic heterogeneity was not considered here) the effect of just a small legacy population on vegetation development (the colors indicate a competition index as proxy of vegetation density here) gets quite apparent. Which brings me back to the title of the post: every tree counts!

<img src='tiki-view_blog_post_image.php?imgId=9' border='0' alt='image' width=400/>
<img src='tiki-view_blog_post_image.php?imgId=10' border='0' alt='image' width=400/>

a disturbed future?

Monday 06 of December, 2010

First of all, apologies for the long intervals between posts. The fact that I haven’t been posting any news for quite a while doesn’t mean that there is no progress in our project though. In fact quite the opposite is true, one could say that the “iLand jigsaw” has been falling into place over the last month and that we’re already discussing first potential applications of the model. What I want to write about today thus focuses less on the latest achievements in model development (I promise to write another post on that soon), but rather on why this is all useful and what we can potentially gain from it.

I recently had the opportunity to work with a group of colleagues from a variety of countries and background on the current state of the art in modeling natural disturbances in forest ecosystems. Looking at a number of different disturbance agents, from wildfire to ungulate browsing, while applying an unifying analysis framework from disturbance ecology gave us a unique perspective on the advances and challenges in disturbance modeling. One thing that we found was that disturbance modeling really took off over the last 15 years, with a steep increase in the number of models and approaches published. This is good news, considering that a recent analysis by one of the doyens of the field, Monica Turner, underlines that disturbances are of crucial importance in ecology, and need to receive more attention in the future, particularly taking into account the potential effects of climate change on disturbance processes. She states that “spatial and temporal variation in disturbance and successional processes must be incorporated more explicitly into studies of global change”, and that “ecologists must increase efforts to understand and anticipate the causes and consequences of changing disturbance regimes”. Modeling is a prime tool for addressing these challenges. However, what our disturbance modeling analysis also documented, was that although the number and application of disturbance models increases, the integrated, process-based, and dynamic systems approach necessary to fully address the issues that we’re facing still remains challenging.

This challenge is one major motivation for developing iLand: Operating from a hierarchical multi-scale perspective, and scaling explicitly from the individual tree to the landscape makes iLand a suitable platform to incorporate disturbance processes that are driven by local conditions, but have the potential to effect large forest landscapes. These complex interactions between vegetation and disturbance agents, both mediated by climate, can be explicitly simulated in iLand, and allow us to investigate altered disturbance regimes and novel trajectories as emerging property of the model. We’re excited about using our approach in this context, and contribute to an improved understanding of potential climate change effects on forest ecosystems.

Drinking will get you (ex)cited!

Monday 21 of June, 2010

Disclaimer: This is a totally modeling-unrelated post, so no tech specs and ecology thoughts this time.

I’ve been thinking about our way of disseminating science recently (which evidently strongly influences the way we do science in general, since it’s the day and age of ‘publish or perish’), and who and what gets recognition in the scientific world. Well, here is an interesting bit that I stumbled upon:
Your chances to get highly cited are good, if you are

  • male
  • between 50 and 70
  • work in the Western world, preferably the U.S. of A.
  • focus on theoretical questions rather than applied, socially beneficial projects
  • and, and that’s the most surprising part (for me at least), have a weak spot for drinking.

According to Parker and coworkers, most of the highest cited scientists in Ecology and the Environmental Sciences drink more than the average American, 54% of them consume 10 or more alcoholic beverages per week, and still 10% have even more than 20 drinks per week. Think for a second (Pareto principle, anyone?) which of the factors above you can influence most easily... right!
So instead of posting my most recently published article here, I figured I’d rather have another beer to get it read (and cited). And I assume by now you’re on your way to the bar… Cheers!

Putting simulated forest structure to the test

Monday 31 of May, 2010

I know my posts here come in irregular intervals, but there has been a lot happening in the iLand universe lately, keeping me quite busy. However, now it’s time for some more updates… here another blurb on what has kept me (and Werner) occupied during the last weeks. And that was basically putting iLands abilities with regard to simulating complex forest structures to the test.

And for that, we were in the lucky position to be able to use detailed data on a very interesting temperate forest ecosystem, Pacific Northwest old growth forests. Besides their awe-inspiring majesty and their recent history of ecological discovery and social controversy, they are particularly interesting for the task of model evaluation, as there is hardly a more challenging forest ecosystem imaginable in terms of modeling forest structure. A system characterized by multiple species, consisting of a multi-story canopy where the height difference between dominant Douglas fir individuals and shade-tolerant new recruits of Western Hemlock easily amounts to more than 60m (and in some cases up to 80m) makes everyone concerned with modeling forest structure sweat, I guess.

We are using multiple data sets both from the Pacific Northwest and the Eastern Alps to evaluate a number of aspects in iLand, an were able to use long-term vegetation data from the HJ Andrews experimental forest to evaluate simulated stand structure against observed stand development. And considering the process resolution of iLand (see previous post on intermediate level of complexity) and the heterogeneity and complexity of these systems, the results obtained in our evaluation are quite encouraging. The model is basically capable to reproduce observed stand structures over the 20+ year observation period for selected reference stands in the HJ Andrews. Below a histogram of observed and predicted stem number distributions after a 22 year simulation for reference stand 31 (a site and stand description can be found here, observed data courtesy of Harmon and Munger 2005).

<img src='tiki-view_blog_post_image.php?imgId=4' border='0' alt='image' width=700 />

Model complexity and iLands niche in the complexity landscape of forest models

Monday 31 of May, 2010

To follow up on the complexity considerations in the last blog entry, the two main hypothesis driving the development of iLand with regard to ecological complexity are:

  • To study the effects and interactions between climate (change), forest ecosystem dynamics and management, a reductionist approach is not applicable. I.e. since we’re increasingly aware that relevant traits in the context of ecosystem dynamics and sustainability, such as resilience and ecological complexity, result from the interplay of processes across scales, an isolated focus on individual dimensions of complexity (e.g. on either structural, functional, spatial traits of ecosystems) is likely to fall short of capturing these key traits.
  • While we need to consider different aspects and dimensions of complexity, and the respective process interactions, to simulate ecosystem dynamics as emerging property, it is not necessary to render all these processes in the highest available level of detail. This theory of the intermediate level of complexity has been formulated for the research process in general, and has also found to be of particular relevance for individual-based modeling.

As initial step to model development in iLand we conducted an in-depth analysis of the existing ‘landscape’ of forest ecosystem models, and subsequently selected and developed approaches the satisfied both of the above hypotheses. In other words, iLand model design aims for a balanced representation of structural, functional and spatial aspects of ecological complexity and their interactions, while implementing processes at an intermediate level of complexity. The analysis of iLands ‘niche’ in the complexity landscape of forest ecosystem models can be found here as a wiki-paper (use the toc on the top of the page to navigate its sections).