The permafrost module of iLand simulates permafrost and soil-surface organic layer (SOL) dynamics at a fine spatial (1 ha) and temporal (daily) resolution. It efficiently models daily changes in permafrost depth, annual SOL accumulation, and their complex effects on boreal forest structure and functions.
Permafrost Dynamics
The module simulates the annual freeze-thaw cycle of the active layer, driven by heat transfer from the atmosphere and the deeper permafrost layer. Key elements include:
- Active Layer: The top layer of soil that freezes and thaws annually.
- Zero Isoline: The depth where the soil temperature is 0°C, separating frozen and thawed soil.
- Energy Fluxes:
- Primary Flux: Heat transfer from the atmosphere to the soil, driving active layer dynamics.
- Secondary Flux: Heat transfer from the deeper permafrost layer, influencing the freezing process.
- Resistances: Thermal resistances of snow, SOL, and mineral soil are considered to affect heat transfer.
- Snow Depth: Modeled as a function of precipitation and temperature, affecting the insulating properties of the soil
Soil Organic Layer (SOL):
- Composition: Includes litter and dead moss.
- Dynamics: Depth is modeled based on litter and coarse wood production and decomposition.
- Thermal Conductivity: Varies with soil moisture and texture.
SOL and Moss Dynamics
The module also simulates the growth dynamics of the moss layer, which plays a crucial role in insulating the permafrost. Key features include:
- Moss Growth: Influenced by light availability (affected by canopy cover), temperature, and litter accumulation.
- Moss Litter: Decomposes and contributes to the SOL, influencing its insulating properties.
- Effects on Ecosystem:
- Tree Establishment: Thick SOL layers can hinder tree seedling establishment.
- Water Cycle: Permafrost and SOL depth affect water availability for trees.
- Fire Dynamics: The moss layer acts as both fuel and insulation in fire events.
Settings in the project file
The “permafrost” section is a sub-section of “model.settings”. Example with full names: model.settings.permafrost.lambdaSnow, model.settings.permafrost.moss.light_sat. To enable / switch on the module, set model.settings.permafrost.enabled to true.
Key |
Datatype |
Description |
enabled |
Boolean |
Permafrost sub module switched on when true |
onlySimulate |
Boolean |
if true, permafrost is calculated but has no effect on the water cycle |
initialGroundTemperature |
numeric |
Initial temperature in depth ‘groundBaseDepth’ below the active layer: at depth "groundBaseDepth" the temperature is assumed to remain +- constant within a year and to follow MAT with a 10yr delay. The initial value is given with 'initialGroundTemperature'. and the depth from which thermal energy flows |
initialDepthFrozen |
Numeric |
depth (m) up to which the soil is frozen at the start of the simulation (1st of January). For permanent permafrost the value is capped at 2m. |
groundBaseDepth |
Numeric |
depth (m) of the zone below the active layer from where the secondary heat flux (from below) originates |
lambdaOrganicLayer |
Numeric | thermal conductivity W/m*K of soil organic layer and moss |
organicLayerDensity |
Numeric |
density (kg/m3) of the soil organic layer (default: 50) |
organicLayerDefaultDepth |
Numeric |
depth of the soil organic layer (m) (only relevant when dynamic carbon cycle is disabled) (default: 0.1) |
maxFreezeThawPerDay |
Numeric |
cap for daily freezing and thawing (mm water column) |
Section moss |
||
biomass |
Numeric |
initial life moss kg/ha |
bulk_density |
Numeric |
Density of the moss layer (kg/m3) |
light_k |
Numeric |
Light extinction coefficient used for tree canopy and moss |
light_comp |
Numeric |
light compensation point: light level (proportion of light above canopy) above which photosynthesis is possible |
light_sat |
Numeric |
light saturation point: level of light (relative to light level above canopy) above which an increase in light does not increase GPP |
respiration_b |
Numeric |
Annual loss of moss biomass due to respiration (flux to atmosphere) |
respiration_q |
numeric |
Annual loss of moss biomass due to turnover (flux to litter) |
CNRatio |
Numeric |
CN-ratio of moss litter entering the litter pool of iLand |
r_decomp |
Numeric |
Decomposition rate of moss litter that enters the litter pool of iLand |
r_deciduous_inhibition |
Numeric |
Parameter to calculate inhibition effect of fresh broadleaved litter (default: 0.45) |
Related (new) parameters
Key |
Datatype |
Description |
model.settings.snowDensity |
Numeric |
Density of snow in kg/m³ (default: 300) |
model.settings.snowInitialDepth |
Numeric |
Depth of the snow pack (in m) at the start of the simulation (default: 0) |
Permafrost visualization
When the permafrost module is enabled, you can visualize certain aspects in iLand. The following layers are available in the 'permafrost' section:
Option |
description |
|
maxDepthFrozen |
maximum depth of freezing (m). Is 2m for full freeze. |
|
maxDepthThawed |
maximum depth of thawing (m). Is 2m for fully thawed soil |
|
deepSoilTemperature |
temperature of ground deep below the soil (C) |
|
maxSnowCover |
maximum snow height (cm) |
|
SOLDepth |
depth of the soil organic layer (litter+dead moss) (cm) |
|
moss |
depth of the life moss layer (cm) |
|
Note that you can access / retrieve those grids in Javascript, e.g., to save them as files for external analysis.
Species parameter related to permafrost
The (new) species parameter “estSOLthickness” is used to specify the species-specific establishment response to thick soil organic layer (0: no effect).
Permafrost related outputs
Water-Output
Columns related to permafrost in the water output (annual timesteps)
Column |
description |
|
maxDepthFrozen |
Permafrost: maximum depth of freezing (m). The value is 2m when soil is fully frozen in a year." |
|
maxDepthThawed |
Permafrost: maximum depth of thawing (m). The value is 2m if soil is fully thawed in a year. |
|
maxSnowCover |
Permafrost: maximum snow height (m) in a year. |
|
SOLLayer |
Permafrost: total depth of soil organic layer (excl. life moss) (m). |
|
mossLayer |
depth of the life moss layer (m). |
|
Debug-Output (water)
Daily values for the state of permafrost (per resource unit) are in the water-debug output:
Column |
description |
|
pftop |
top of frozen layer (m) when thawing (above that soil is thawed) |
|
pfbottom |
bottom of the frozen layer (m) (important for seasonal permafrost; soil is frozen *up to* this depth), for permanent permafrost, the bottom is 2m |
|
pffreezeback |
depth (m) up to which the soil is frozen again (in autumn) |
|
delta_mm |
change of water (mm within iLand water bucket), freezing is negative |
|
delta_soil |
change of ice layer (m) (within iLand water bucket), freezing is negative |
|
thermalConductivity |
Current conductivity of mineral soil W / m2 / K |
|
soilfrozen |
depth of soil (m) that is currently frozen (this is a part of the soil plant accessible soil) |
|
waterfrozen |
amount of water (mm) trapped currently in ice |
|
current_capacity |
Current field capacity of the (non-frozen) soil bucket (mm) |
|
moss_fLight |
Value of the light response for moss growth |
|
moss_fDecid |
Value of the limiting factor of deciduous litter |
|
moss_fCanopy |
Response value for the drying out effect due to canopy openness |
|
Creating custom permafrost graphs
# R example code
# rids: data.frame with a selection of resource ids
# dbg_wc: file created by debug output
ggplot( rids %>% left_join(dbg_wc) %>% group_by(rid, year) %>% mutate(n=row_number()) %>% ungroup() %>%
          mutate(   groundice.high = pmax(pftop, pffreezeback),
                    topice.min = pmin(pftop, pffreezeback)), aes(x=n)) +
  geom_ribbon( aes( ymax=2, ymin=pfbottom), fill="lightblue" ) +
  geom_ribbon( aes( ymax=pfbottom, ymin=groundice.high), fill="darkgray" ) +
  geom_ribbon( aes( ymax=groundice.high, ymin=topice.min), fill="lightblue" ) +
  geom_ribbon( aes( ymax=topice.min, ymin=0), fill="darkgray" ) +
  geom_ribbon (aes( ymax= -snow_height/300, ymin=0), fill="lightgray") +
  geom_line (aes(y=-temp/100)) +
  scale_y_reverse() + facet_wrap(~round(tmean,2)) + theme_bw()
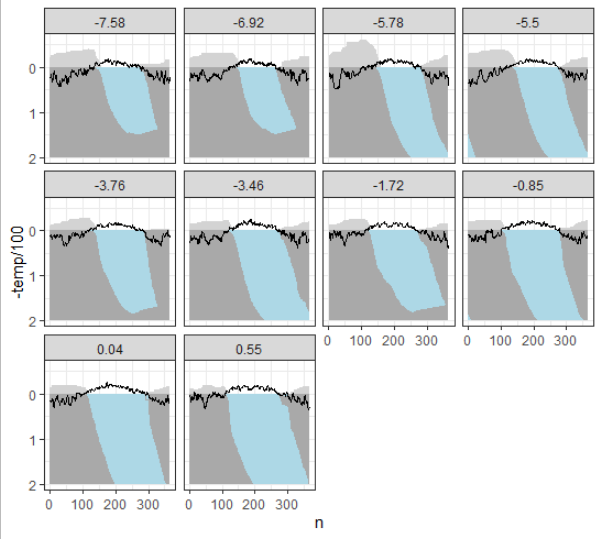
The code creates figures such as:
;)