Aggregating the individual indicator scores to the three respective dimensions allows a 3D illustration of the models niches in the landscape of models. Figure 2 gives a 3D account of this approximate niche space, and Figure 3 resolves the three dimensions into 2D plots.
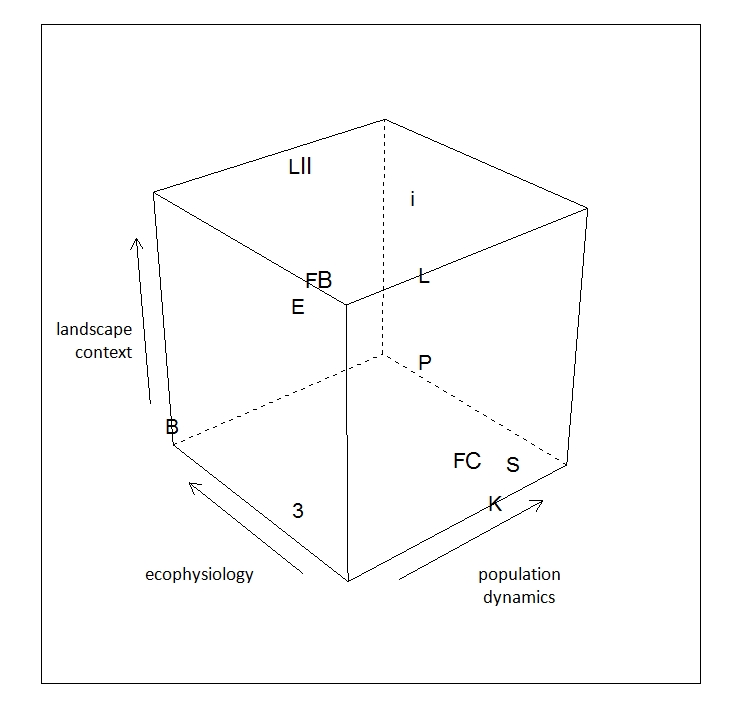
Figure 2: The 3D landscape of models as defined by relative complexity in the dimensions population dynamics (structural complexity), ecophysiology (functional complexity) and landscape context (spatial complexity). Arrows indicate increasing level of complexity. Alphanumeric symbols denote the models analysed in this study: S=SORTIE, K=KiWi, FC=ForClim, B=BiomeBGC, 3=3-PG, FB=FireBGC, E=ED, L=LANDIS, LII=LANDIS-II, i=iLand.
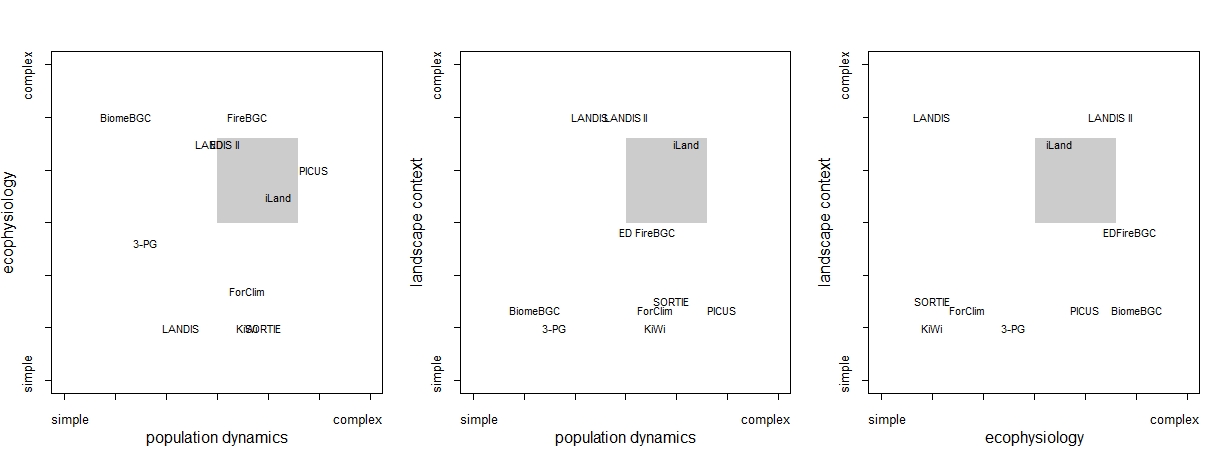
Figure 3: Twodimensional renderings of the landscape of models as defined by model complexity in the three dimensions population dynamics (structural complexity), ecophysiology (functional complexity) and landscape context (spatial complexity). Grey shaded the "niche" of iLand in the landscape of reference models.
This analysis shows iLands intended niche in the intermediate to high complexity range of all three dimensions. Closest reference model neighbors to this niche are LANDIS-II and FireBGC. The balance of complexity between the three dimensions can be displayed in a triangle chart, where the three sides give the relative degree of complexity for each model in the three dimensions (i.e. the respective complexity scoring for the dimension divided by the sum of all complexity scorings per model). A model of perfectly balanced complexity between the three dimensions (0.33 for every axis) would be situated in the center of the triangle. Figure 4 shows that iLand and LANDIS-II are situated close to the center, featuring the best balance between population dynamics, ecophysiology and landscape context of the models analyzed in this exercise.
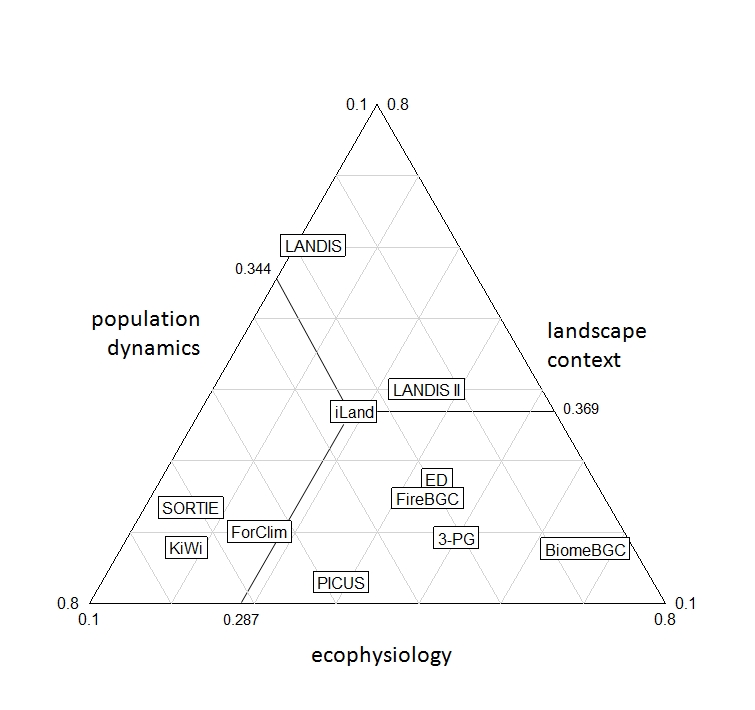
Figure 4: Triangle plot showing the relative complexity in the individual dimensions.
;)