This page describes the user interface of the iLand viewer application. This software contains the iLand "core" model embedded in an modern user interface. Be cautioned: the software is not a dedicated end user tool, but rather a research tool - so sometimes the design may be a bit quirky, or the behavior odd; however, the iLand user interface matured over the time and includes now some valueable functions that can make the life of the model user easier.
The main window
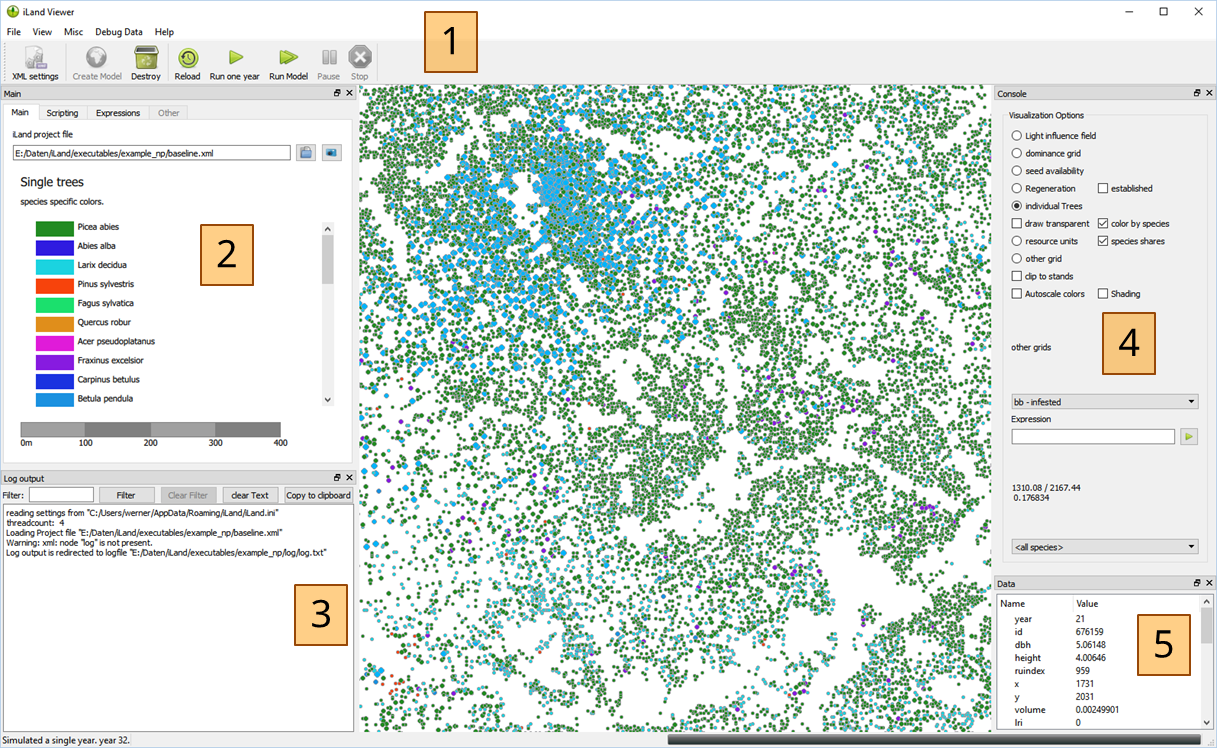 The iLand viewer has a number of main components: (1) The toolbar provides access to the most important functions: you can create / destroy a landscape (destroying means deleting and freeing all ressources), and run the model for 1 year or multiple years. While running, you can pause or cancel (Stop button) the execution. (2) The main panel shows the legend, but provides also access to the scripting engine - see below (3) The logging area shows all the log messages from the model (if logging is not redirected to a log file). This kind of log info is especially helpful to track configuration or model errors. (4) There are many options to customize the main visualization in iLand (see below) (5) Clicking on a single tree or on a resource unit populates this detail view of tree/resource unit variables
Running a simulation in iLand
In order to run simulations with iLand you need to (see also figure below): • Start The iLand viewer (iland.exe) (see also http://iland-model.org/iLand+Software) • Select a project file (in the File menu or in the side panel (2)) • Create the model ("Create" button in the toolbar). This sets up the model landscape and initial trees. • Run the model ("Run many" button in the toolbar). Enter the number of years you want the model to run. • While the model is running (there is also a “Pause” button), you can view different types of data in the GUI visualization (see below) • The bulk of numeric outputs of the model are stored in an output database (http://iland-model.org/Outputs). See http://iland-model.org/Software+Tools for tools helping to access the SQLite databases iLand uses to store simulation results in (it is also quite easy to read these databases into, for instance, R for further analysis).
Main panel
The main side panel has multiple tabs: the main tab shows the legend and rulers, the "scripting" tab lets the user access the power of the Javascript engine, and the "Expressions" tab provides access to statistics of the tree population.
Main tab
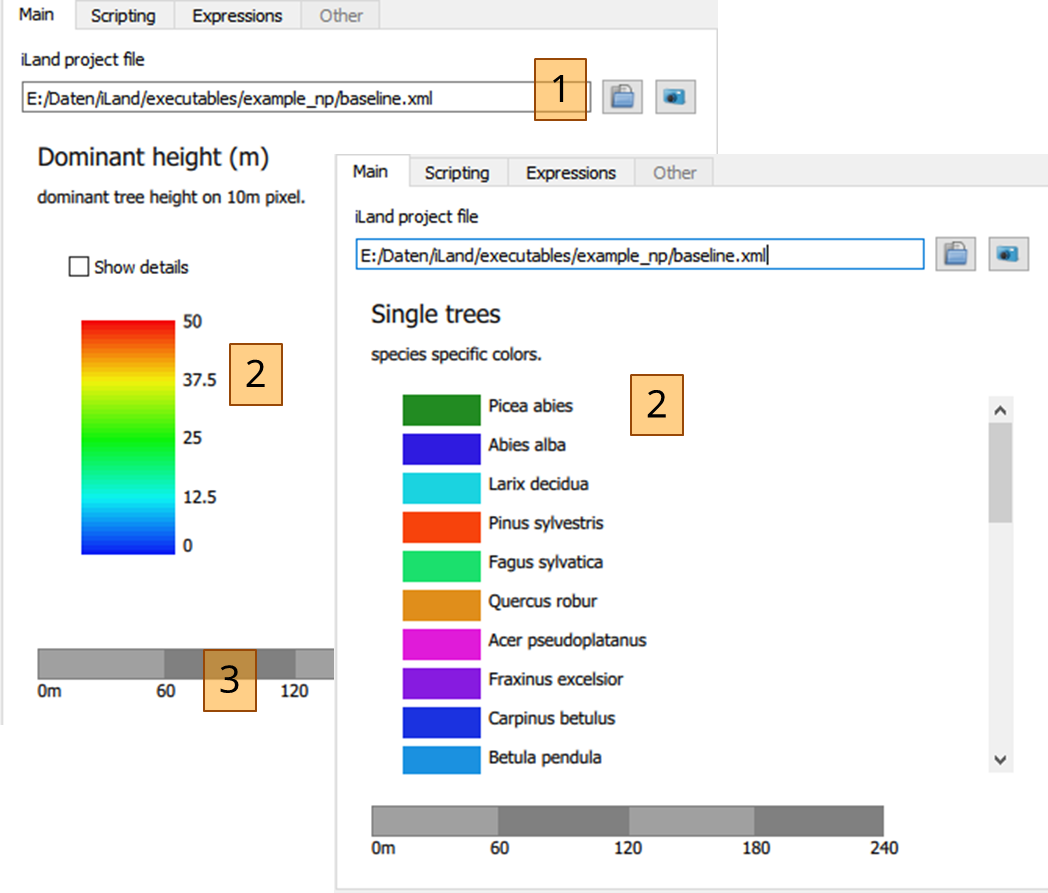
The main tab lets you load project file and shows the current legend and ruler. (1) Click the 'open' icon to select an XML project file (or use the File->Open command); the 'view' button shows the XML content. To create the model, use then the buttons in the toolbar (see above). (2) the legend depends on the selected visualization option; there are, broadly speaking, two types of legends: continuous numerical values (such as tree heights or standing volume) and unique values (such as tree species or stand Ids). For continuous variables, the value range can be edited after checking "show details" (3) The ruler shows the scale of the current visualization
working with the Javascript tab
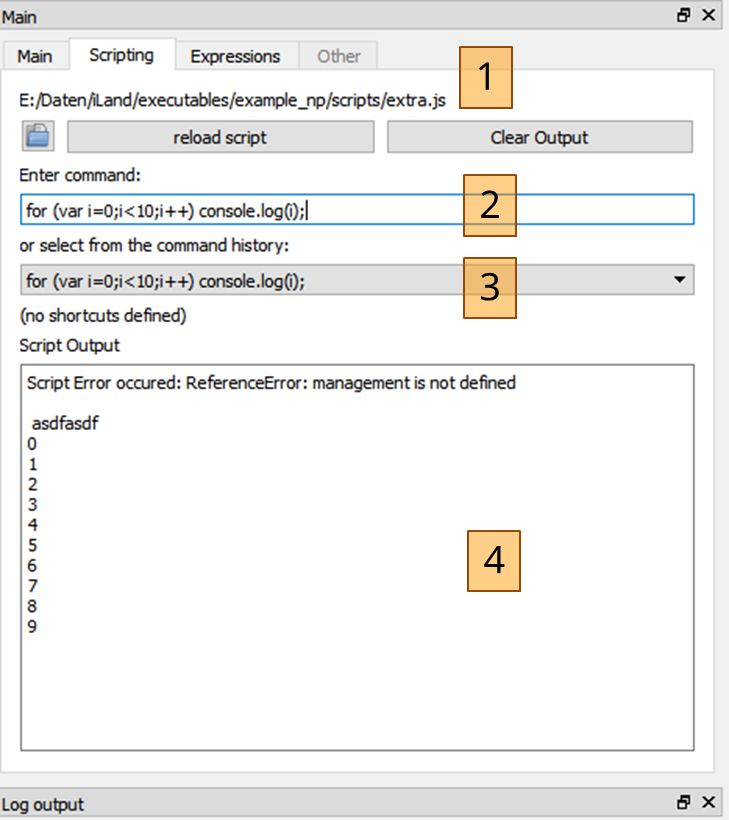
The 'scripting' tab allows a direct access to the Javascript engine in iLand. You can: (1) Load / reload a script file; reloading means, that the file is re-evaluated in the current context. You can conveniently edit externally and quickly reload/execute code. (2) enter commands here. This can be function calls to user-defined functions (see (1)), calls to the the iLand system libraries, or even full programs (see example). (3) executed commands are stored in the command history and can quickly be recovered. In addition, often used commands can be made accessible as links below (3). See the setUIshortcuts method of the Globals object. (4) script output (e.g. results of 'console.log()' calls) is printed in this area. Note, that output is also redirected to the iLand log. See iLand scripting for more on the scripting capabilities of iLand, and the Scripting page for diving into the iLand API. Note that availability of some functions depend on the enabled modules of iLand.
working with the Expressions tab
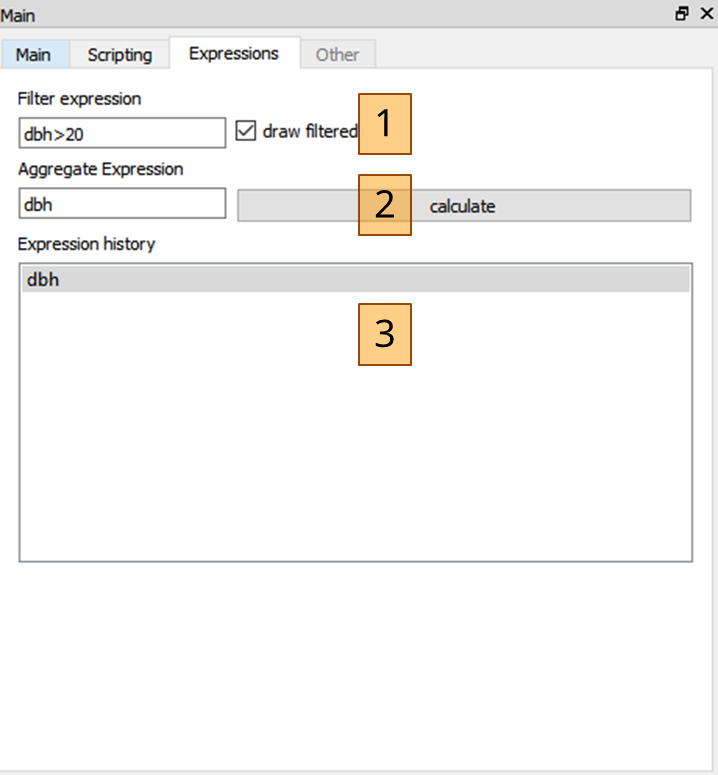
The 'expression' tab allows some basic analysis of the properties of the trees on the landscape. You can: (1) Filter the trees that should be considered. See expression for details, and tree variables for a list of all available tree variables. Note that you can filter also by species (e.g., species=piab). Checking "draw filtered" shows graphically (after a redraw) which trees pass the filter expression. (2) give the 'aggregate' expression that should be run over all trees. Again, any valid expression (see above) can be used. Clicking 'calculate' evaluates the expression over all (filtered) trees and prints summary statistics to the log (the sum, min/max/average, the 25th, 50th, 75th and 90th percentile). Example:
expression: "dbh" filtered 210234 of 1685551 sum: 5.99994e+06 min 20.0002 max 56.8928 average 28.5393 P25 23.0976 median 26.8859 P75 32.843 P90 38.4874
(3) executed commands are stored in an expression history (double click to reload the expression)
Visualization
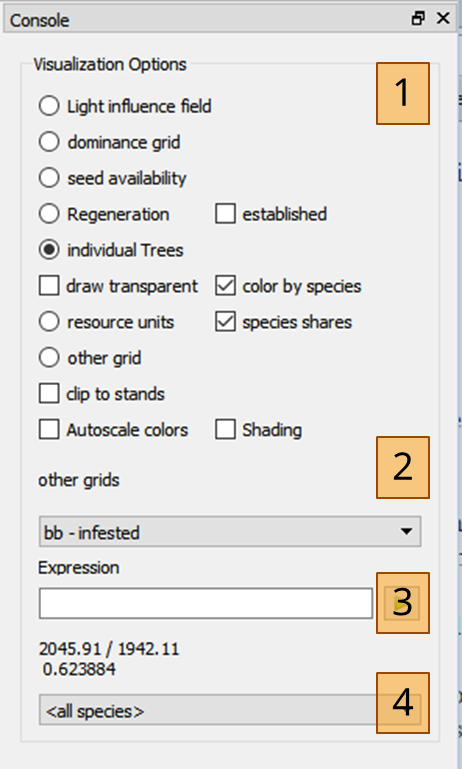
iLand provides means to visualize what is "going on" in the simulation visually. This feature has many times proven to be very important and useful: it allows researchers to get a feeling of what is really happening in the model, and it is a powerful tool for spying problems, but also for finding cues for solving those issues. The basic options are (1):
- Light influence field”: This is the “LIF” (http://iland-model.org/competition+for+light). Red means low, blue high light levels. Spatial resolution is a 2m grid.
- “dominance grid”: this are maximum tree heights at 10m resolution; areas outside of the project area are either drawn grey (areas that are assumed to being forested) or white (for non-forested areas).
- "seed availability": This shows the seed availablility of a selected species (4) on the 20m seed dispersal grid.
- "regeneration": shows the state of the regeneration layer (2m resolution). The height of cohorts are shown for a selected species (4). If no species is selected (4), the value is the maximum height of all living cohorts on that pixel. Note, that the maps are generated on the fly and may be slow to create. If the "established" box is checked, only newly established cohorts are shown (with value=1 for pixels with new cohorts). The species filter (4) works as described above.
- “Individual trees” shows tree crowns from bird’s eye perspective (i.e. as stylized circles with the radius indicating the size of the tree). The color indicates their competitive status as described by the light resource index (LRI, again, red means low LRIs, see competition for light). Check 'color by species' to draw trees in species-specifc colors. The "draw transparent" option adds transparancy, which may help visualize dense multi-story forests. There are additional options for defining which trees to draw: use the species filter (4) or the "expressions" in the main side panel.
- “resource unit” show the resource units, i.e. a 100m grid used for the calculation of e.g. the water balance. (resource units). Shown is either the result of an expression (see below), or species shares (when "species shares" is checked): In this case, if no species is selected (4), each resource unit is drawn with the color of the dominant species, ie. the species with the highest basea area share. The color is dashed, if the dominant species has a share < 50% (i.e., shows not a clear dominance). If a species is selected, then the basal area of that respective species is drawn (you may check the "autoscale" option)
- "other grid": some modules of iLand provide additional grids that can be visualized (2). Examples are a digital elevation model, details of disturbance modules, and several layers of the agent based forest management engine. Each layer has a brief description and has a legend (i.e. color ramp and value range).
- the "shading" box: If a digital elevation model (DEM) is loaded with the current project, then enabling shading adds a feeling of the topography
Clicking on a tree and a resource unit, respectively, shows their attribute in the “Data” box in the lower right corner. You can enter mathematical expressions (expression) using these variables in the „Expression“ field to visualize various aspects (e.g. “dbh” or “dbh*dbh/4*3.141592” to calculate basal area). For trees, the scale is fixed to 0-1, so you might have to adapt your expressions (e.g. "dbh/100"). For resource units, the "Autoscale colors" options can be used to auto-scale to the value range of the current expression. The "clip to stands" option masks out grids (especially the "other" grids) with the project area (as given by the stand grid). The "autoscale" colors scales the visualization to the value range in the data. Note, that this works only for some options. The "shading" is an experimental feature, which works only when a DEM is available: it then overlays the DEM shading with the current visualization. The coordinates under the current mouse position are shown above the species filter (4). The coordinates are always in meters, and are relative to the location defined in the project file. In addition to the coordinates, the value under the mouse is shown (this works not for all types of visualization).
landscape visualization - using the mouse
The visualization of the landscape is a prominent feature of the Viewer application. Here are some notes on how to operate the zoom/pan features:
Zoom in / out
Use the mouse wheel (while positioned over the landscape) or use the '+' or '-' keys of the keyboard. For keyboard zoom the focus must be on the landscape, i.e. a single click into the landscape might be necessary.
Pan
Click with the left mouse button and drag. After releasing the mouse button the landscape is redrawn (so there is no visual indication during the drag process except the changed mouse cursor).
Select a tree/resource unit
Clicking with the left mouse button inside the landscape will select a single tree and show a list of tree properties in the data view window. If the current view is "resource units", then resource unit aggregates are shown.
Screenshots
You can copy a "screenshot" of the main visualization area to the clipboard by pressing "Ctrl-P" or by selecting "copy image to clipboard" in the "View" menu. In addition, the screenshot is saved as "screenshot.png" in the project directory.
Useful keys
Press 'F5' to refresh the visualization area, press the 'F6' key to zoom out to the full landscape.
Miscellaneous
Default project file
iLand tries to reload the last loaded project file. To accomplish this, iLand saves the name of the last successfully loaded project file in a small text file named "lastxmlfile.txt" loacted in the same directory as the executable itself. On startup, iLand uses this information if present. This behavior is overruled, if a XML filename is provided as a command-line argument to the executable (e.g. iland.exe e:\iland\project\project1.xml).
Controlling the visualization with Javascript
iLand allows to control the visualization via Javascript. This can be achieved via the Globals-Javascript object:
- control the current extent (i.e. the visible area), see the 'setViewport' function
- control the options of the visualization (this is more experimental): the viewOptions-property
- make screenshots to a given file, force a repainting of the screen, and wait for a given time (the screenshot(), repaint() and wait() functions, respectively).
Those techniques can be used to create animations (that are put together from individual screenshots).
Automating the iLand Viewer
There is limited support for automating simulations with the iLand viewer, as the main tool for such tasks is the console version. However, you can run also the iLand viewer in a "batch" mode, by starting from the command line with parameters:
iland.exe run
If iLand detects the "run" command, it immediately loads the given XML project file and start a simulation for the given number of years. For instance, you could prepare a number of project files that can then be automatically simulated one after another:
iland.exe run 100 path/to/testplot1.xml iland.exe run 100 path/to/testplot2.xml ...
Note that a simple log file of batch operations is maintained: every time iLand starts in batch mode, some details (e.g., project file, time, ...) are added to a file called "batchlog.txt", located in the directory of the executable file (creation of that file may fail due to permission problems).
The About box
A little "About" dialog is accessible from the main menu (Help->About iLand). A piece of information here can be particularly helpful: the model version, the used compiler, the date of building the software, and the revision number in the source code repository (SVN-Revision).
;)