Figure 1 illustrates the level of complexity for the selected indicators in iLand and the reference models chosen for this study. This analysis of complexity naturally reflects the respective domains of application of the individual reference models, i.e. ranging from the analysis of individual-based population dynamics (SORTIE, KiWi) to ecophysiological processes (BiomBGC) and landscape dynamics (LANDIS). Figure 1 also documents the abilities of modular or hybrid approaches (i.e. LANDIS-II, FireBGC, PICUS in this analysis) to cover a greater number of processes with a considerable level of complexity than model approaches specialized on a particular dimension. This approach is to be further extended in iLand, using a fusion of different concepts to achieve a satisfactory level of complexity for all relevant process indicators and an overall balanced representation of model complexity between the dimensions.
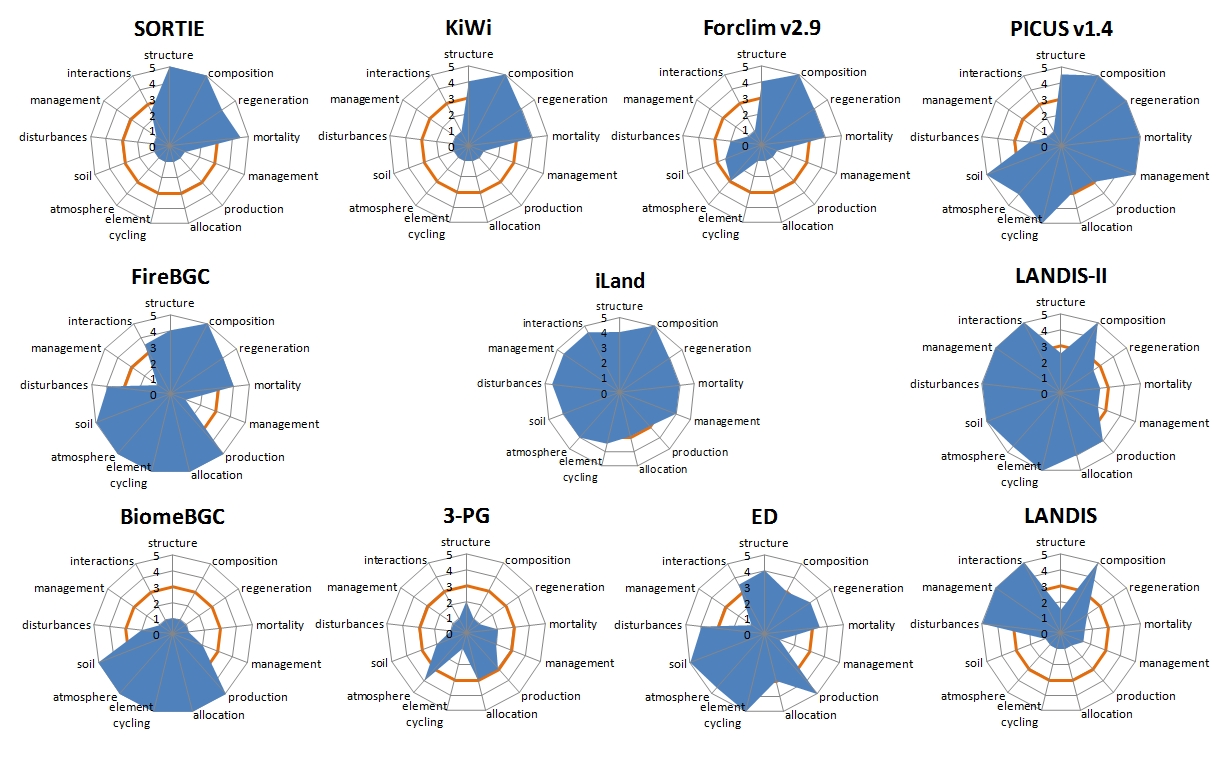
Figure 1: Radar chart of indicator complexity (5= most complex approach; 1= most simple approach) for iLand and the reference models