Intercepting radiation is the main process driving primary production in iLand. Individual tree light resources are modeled in an approach that borrows from ecological field theory and the field of neighborhood approach. The resulting light resource index is applied to estimate an individuals' contribution to resource unit level primary production.
Table of contents
An index of light resource availability
The starting point and foundation to model individual-based competition in iLand are ecological field theory in general (Walker 1989) and the field of neighborhood approach presented by Berger and Hildebrandt (2000) in particular. The general idea is that every tree exerts an influence field on its resource neighborhood, where both intensity and dimension of the influence depend on tree characteristics (e.g., size, leaf area). The KiWi model (Berger and Hildebrandt 2000), for instance, hypothesized a symmetric, exponentially decreasing field of neighborhood, as an aggregate proxy for above- and belowground competition (Berger and Hildebrandt 2000) as well as for competition for light in particular (Berger et al. 2006). In iLand, we aim for a process-based derivation of an individual trees' light influence patterns (LIP) on its neighborhood, somewhat closer related to the ecological field theory.
Light influence patterns of individual trees
A light influence pattern (LIP) of an individual tree is defined by its influence domain, the field intensity and the respective influence height z*. We derive LIP for discreet tree states as defined by diameter (class width 1cm below 10cm dbh, 2cm between 10cm and 20cm dbh, and 4cm above 20cm dbh) and a wide range of height to diameter ratios (from dense monospecific stands to open-grown trees). Although primary production and position of individuals is continuous in iLand, these discreet LIPs can be seen as cohorts of similar influence on their neighborhood with regard to light resources. We follow Purves et al. (2007) in approximating crown shape by maximum crown radius and a one parameter power function to calculate the crown radius at any given point of the stem (Eq. 1),
| \[\begin{aligned} R^{z}=R_{max}\cdot \left ( \frac{min(z,z_{max})}{z_{max}} \right )^{B} \end{aligned} \] | Eq. 1 |
with Rz the radius at tree height z, Rmax the maximum radius of a tree of the same diameter (at the tree height of zmax, assumed at 95% of the tree height from top) and B a shape parameter with B=1 resulting in a conical crown, B<1 giving convex and B>1 concave crowns respectively. Maximum crown radius can be estimated from diameter at breast height by means of allometric equations (Hasenauer 1997, Purves et al. 2007). Starting from a generic constant crown length of 50% of tree height we corrected for an average species-specific offset based on Purves’ et al. (2007) Vbias parameter (i.e. related to a species' shade tolerance), but assumed constant intraspecific crown length over tree size.
The influence of the thus rendered trees on their light environment is derived by calculation of global light index (GLI, Canham et al. 1988). To that end we partitioned the 3D space around an individual in 2x2x2m blocks and derive a GLIx,y,z (i.e. radiation relative to above canopy radiation integrated over all sun angles per year of a given latitude, in other words an integral over a digital fisheye photo relative to total radiation) for every one of these voxels (see Figure 1). We follow Pacala et al. (1996) in restricting the GLI to an angle of 45° from zenith since this segment was found to capture the most relevant portion of a trees light environment (Canham et al. 1990). Furthermore, the influence domain of the LIP, i.e. the maximum radius around an individual for which neighbors are influenced, is theoretically defined by the zenith angles considered by GLI, i.e. for a 90° focal cone none of the rays in GLI are obscured by the tree crown at a distance greater than tree height. We, however, reduce this theoretical maximum influence domain to account for the most relevant influence (and increase performance) according to aggregated field strength (see below).
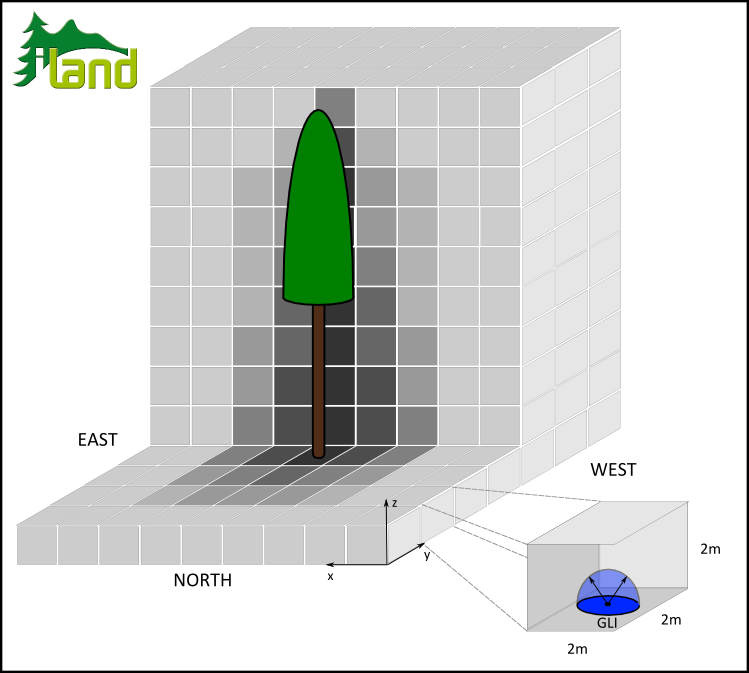 Figure 1: Derivation of light influence pattern (LIP) intensity by means of global light index (GLI, Canham et al. 1988).
An aggregated measure of field intensity (ix,y) is derived by averaging GLIx,y,z values up to the respective z* for every x,y LIP grid cell, Eq. (2):
| \[\begin{aligned} i^{x,y}=\frac{\sum_{z\leq z*}^{}GLI^{x,y,z}}{z*^{x,y}} \end{aligned} \] | Eq. 2 |
Actual field domain is derived as the pixel radius (i.e. rings of pixels from the trees parent pixel, or the degree of pixel neighborhood) where maximum ix,y (i.e. the field intensity directly to the north of a tree for applications in the northern hemisphere) is <5%, reducing the LIP dimension for about 35-40% compared to the maximum domain defined by GLI trigonometry. The resulting LIP domains are in congruence with the empirical light competition index of Pretzsch et al. (2002), employing a 30° cone to capture competitive influence of neighboring trees. Figure 2 illustrates the final representation of an individual trees’ LIP, as comprised by separate fields for intensity and height of influence over the respective domain.
These LIPs are derived in a pre-processing routine prior to the actual simulation for every species and dimension cohort. While domain and height of influence remain constant for a tree of certain species and dimension throughout the simulation, we account for feedbacks of individual tree leaf area on its LIP intensity. While full crown opacity is assumed in the GLI calculations during pre-processing, LIP intensities are updated accounting for a trees’ dynamically simulated LAI and the corresponding potential to intercept radiation by multiplying the intensity field with an individual tree equivalent of Beers law (driven by LAj and crown surface area calculated from Eq.1). Consequently, trees of the same dimension (diameter, height) but with different LAI (e.g. due to insect defoliation, low carbon gain due to environmental stress) exert a different intensity of light competition on their environment.
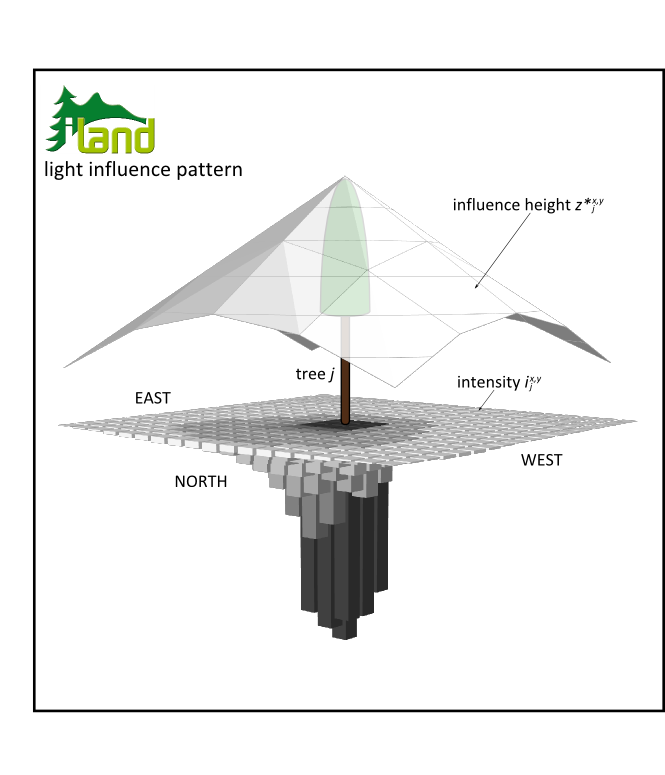 Figure 2: A trees’ light influence pattern, consisting of fields for intensity and height of influence.
A light influence field in forest stands and landscapes
Applied to forest stands and landscapes the LIPs of individuals (j) are overlaid considering tree position and LIP domain to derive a continuous light influence field (LIF) for the simulation area. First, a field of influence height Z* is derived as the maximum over the heights of all trees whose crown (radius) affects any given 10x10m cell. We chose a 10x10m resolution (indexed u,v) to render Z*u,v at landscape scale as this resolution corresponds to the approximate size of a mature, dominant individual in undisturbed forests (cf. Lexer and Hönninger 2001). Second, the intensities of every individuals LIP ijx,y are scaled to the respective Z*u,v (Eq. 3),
| \[\begin{aligned} i*_{j}^{x,y}=i_{j}^{x,y}\cdot min(\frac{z*_{j}^{x,y}}{z*^{u,v}}\: ,\: 1) \end{aligned} \] | Eq. 3 |
with \[\begin{aligned} x\in u \cap y\in v \end{aligned} \]
This step provides the context for the generic LIP intensities, i.e. while ijx,y are self-referenced average intensities for the z*j pattern of the focal tree j Eq. 3 transforms them to an average intensity for the current influence height Z* of a trees' surrounding. This scaling of intensity with height is a crucial step to resemble asymmetric competition in iLand and its effect is illustrated in Figure 3: While an isolated (i.e. z*jx,y = Z*u,v) small tree exerts a narrow but noticeable reduction in the light intensity field the same tree contributes only little to I*x,y under the canopy of a tall individual (i.e. its z*jx,y << Z*u,v). Thus the actual effect on the light environment depends both on the size of the competing tree as on the size and position of its competitors.
Finally, the thus scaled intensities are aggregated to a compound LIF intensity (Eq. 4).
| \[\begin{aligned} I*^{x,y}=\prod_{j}i*_{j}^{x,y} \end{aligned} \] | Eq. 4 |
We chose multiplicative aggregation (over an additive one, see Berger and Hildebrandt 2000) since (i) it better reflects the process of light extinction in a tree canopy (i.e. the effect of extinction is highest for the first obstacle to ray permeation and diminishes with every additional obstacle in the path of light), and (ii) it retains a 0,1 range for I*x,y allowing straightforward interpretation of the index. The landscape LIF is updated annually in iLand, accounting for changes in tree dimensions as well as strand structure (mediated by ingrowth, management, mortality and disturbances).
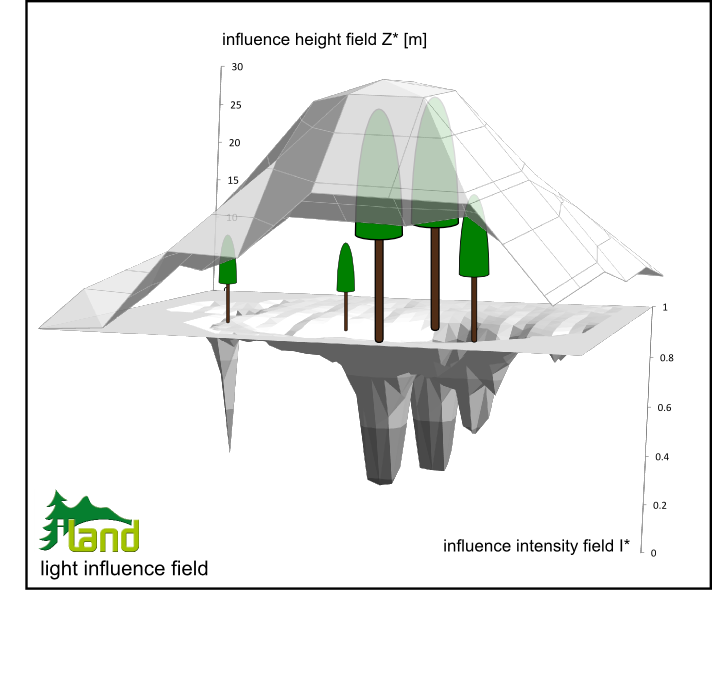 Figure 3: Aggregating individual tree light influence patterns to a continuous light influence field at stand to landscape level.
An individual tree light resource index to describe competitive status
To account for an individuals’ specific situation in the stand canopy in the calculation of radiation interception an index of light resource availability (light resource index, LRI) is calculated. LRIj is a measure of relative light availability for an individual where LRIj=1 indicates no competition for light, i.e. the tree is exposed to full sunlight, and LRIj→0 represents strong light competition. It is structurally comparable to light indices used in other approaches modeling competition of individuals for light explicitly (e.g. Pacala et al. 1996, Lexer and Hönninger 2001). Based on the landscape scale LIF calculation we derive LRI of individual j as an average over all intensities I* influencing its crown projection area (see also Berger and Hildebrandt 2000). To that end the intensity ijx,y that the focal individual j contributes to I*x,y is factored out by division (cf. Eq. 4) and the remaining field (i.e. the combination of neighbors within their respective domain ) averaged over its crown projection area (Eq. 5),
| \[\begin{aligned} LRI_{j}=1-\sum (\frac{I*^{x,y}}{i*_{j}^{x,y}}\cdot p_{j}^{x,y}) \end{aligned} \] | Eq. 5 |
where pjx,y is the share of cell x,y on the crown projection area of individual j.
In addition, the vertical heterogeneity within a 10x10m patch of Z* is taken into account in LRI. Assuming that light extinction within the patch occurs roughly in the upper 75% of the canopy (i.e. that the upper 75% of a tree are photosynthetically active), we penalize LRIs of individuals with z*<Z* by applying Beers law: First, pseudo leaf area density (LAD) is derived by inverting Beers law for a specific LRIj and the respective Z* that it was derived for (Eq. 6)
| \[\begin{aligned} LAD=\frac{ln(LRI_{j})}{-k\cdot 0.75\cdot Z^*} \end{aligned} \] | Eq. 6 |
Second, LRIj is recalculated accounting for the actual height h of the focal tree relative to Z* and the respectively longer path of light penetration through the crown space (Eq. 7)
| \[\begin{aligned} LRI_{j}=e^{-k\cdot LAD\cdot (Z*-0.25\cdot h)} \end{aligned} \] | Eq. 7 |
Eq. 6 and Eq7. can be simplified to Eq. 8:
| \[\begin{aligned} LRI_{j}=e^{\frac{ln(LRI_{j})}{0.75}\cdot (1-\frac{0.25\cdot h}{Z^{*}})} \end{aligned} \] | Eq. 8 |
Evaluation
see page evaluation of light competition
Discussion
Reviewing the iLand approach to simulate competition for light in the context of major aspects of individual-based modeling Berger et al. (2008) reveals the following characteristics:
- heterogeneity (i.e. resources are heterogeneously distributed, the position of a tree in “resource space” matters): heterogeneity is accounted for by iLands dynamic light influence field, the calculation of which is essentially based on a simplified representation of light interception processes.
- modification (i.e. trees modify their surrounding resource levels): individuals decrease the light availability in their vicinity in iLand
- configuration (i.e. spatial configuration matters, the position and configuration of neighbors is relevant for the competitive success of a tree): iLand in this regard accounts for both the distance to neighbors as well as for their direction (e.g., south or north of the focal tree).
- symmetry (i.e. competition among plants is size-specific): competition for light in iLand is asymmetric, i.e. larger individuals have a disproportional advantage over smaller individuals. Asymmetry is introduced particularly by accounting for the influence height Z* (Eq. 9), which favors the respective tree dominating a particular area. Yet also the onset of competition between two individuals is gradual, i.e. there are no generic thresholds of dominance and suppression, e.g. for trees of almost equal size.
- adaptation (plants adapt to their environment in response to competition): A major simplification of the approach is that no crown plasticity (both with regard to dynamic crown length as well as with regard to crown position in the canopy) is accounted for. Although this simplification is embraced by many individual-based models (e.g., Bugmann and Solomon 2000), recent works of Purves et al. (2007) and Seidl et al. (2010) demonstrated the importance and effect of crown level adaptation mechanisms. However, iLand explicitly considers feedbacks of individual crown leaf area on available light resources and competition, which was recently found to be an important aspect in modeling competition by Didion et al. (2009).
Furthermore, the approach is well in line with recent theoretical concepts of plant competition, i.e. it explicitly considers a trees attainable height (and the resulting height development of pure, even-aged stands, cf. R*, Adams et al. 2007) as well as its potential to cast (and tolerate) shade as explicit traits of a successional strategy of tree species (see Loehle 2000, Purves et al. 2008) and simulates them as emerging properties of the model. It, nonetheless, retains the simplification of the FON approach (Berger and Hildebrandt 2000) in reducing the 3D problem of competition for light to a 2D space (with the major extension of considering Z* in iLand). This approach of using an overlay of pre-processed neighborhood fields of competition rather than searching for neighbors and their potential to obstruct light from every focal tree allows the use of efficient grid computing algorithms and essentially enables the simulation of individual-based competition at landscape scale in iLand.
Implementation
Note that the implementation of processes linked to light competition is split into the creation of the light influence patterns of individual trees and all processes dealing with the interactions of many trees on a landscape. The former is done by the Lightroom software - the results of this step are binary data files containing the pattern information for different sizes of individuals of a tree species. All other processes are part of the main iLand model software. See also the software page.
Seidl, R., Rammer, W., Scheller, R.M., Spies, T.A. 2012. An individual-based process model to simulate landscape-scale forest ecosystem dynamics. Ecol. Model. 231, 87-100.